Best suburbs in Adelaide for families
Safety, schools, parks per resident, kinders and childcare, house prices for the size and transit — weighted, and shown.
Aberfoyle Park (84/100), Glenalta (82/100), Seacombe Heights (81/100) lead this ranking of 274 Adelaide suburbs.
By BestSuburbs research · Updated October 2026
Part of Adelaide suburb rankings · all Adelaide lists
Which Adelaide suburbs are best for families?
How do the top 25 compare, measure by measure?
| # | Suburb | Families score | Safety | Schools (govt data) | Green space | Transit | Median house price |
|---|---|---|---|---|---|---|---|
| 1 | 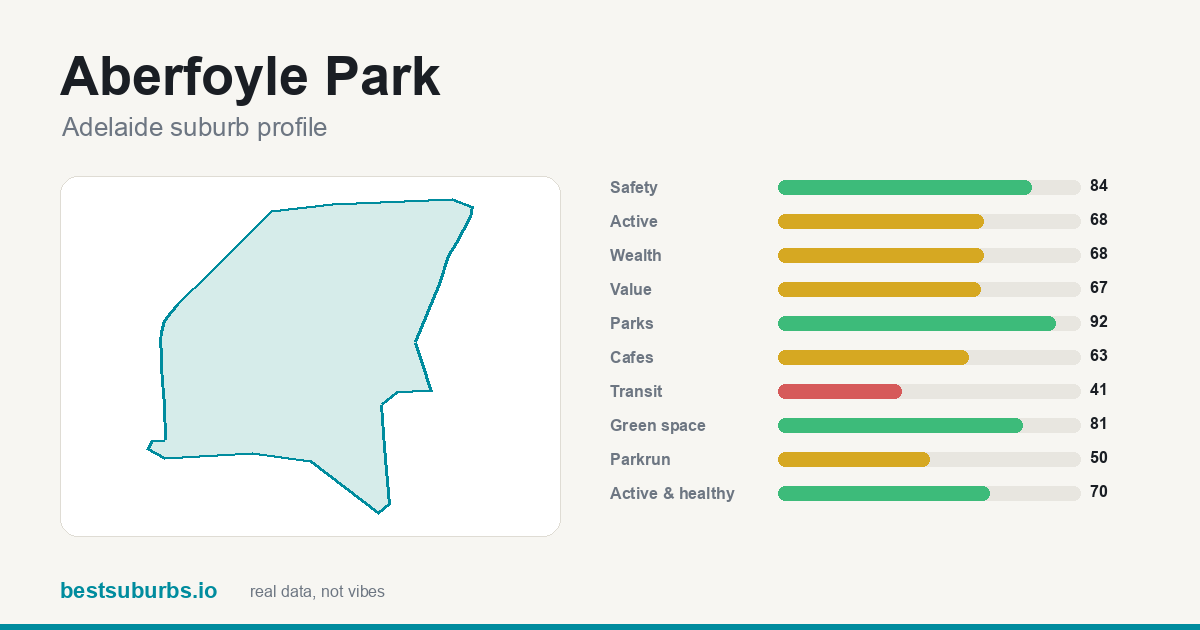 Aberfoyle Park Aberfoyle Park | 84 | 84 | 7 | 81 | 37 | $940,000 |
| 2 | 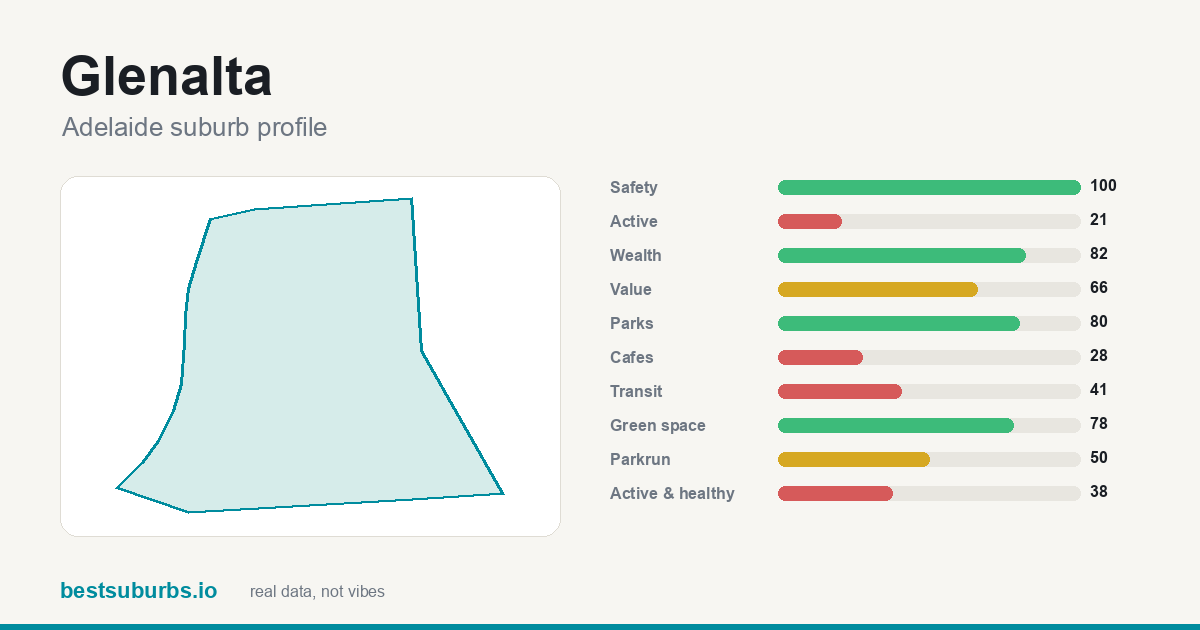 Glenalta Glenalta | 82 | 100 | 0 | 78 | 93 | $1,230,000 |
| 3 | 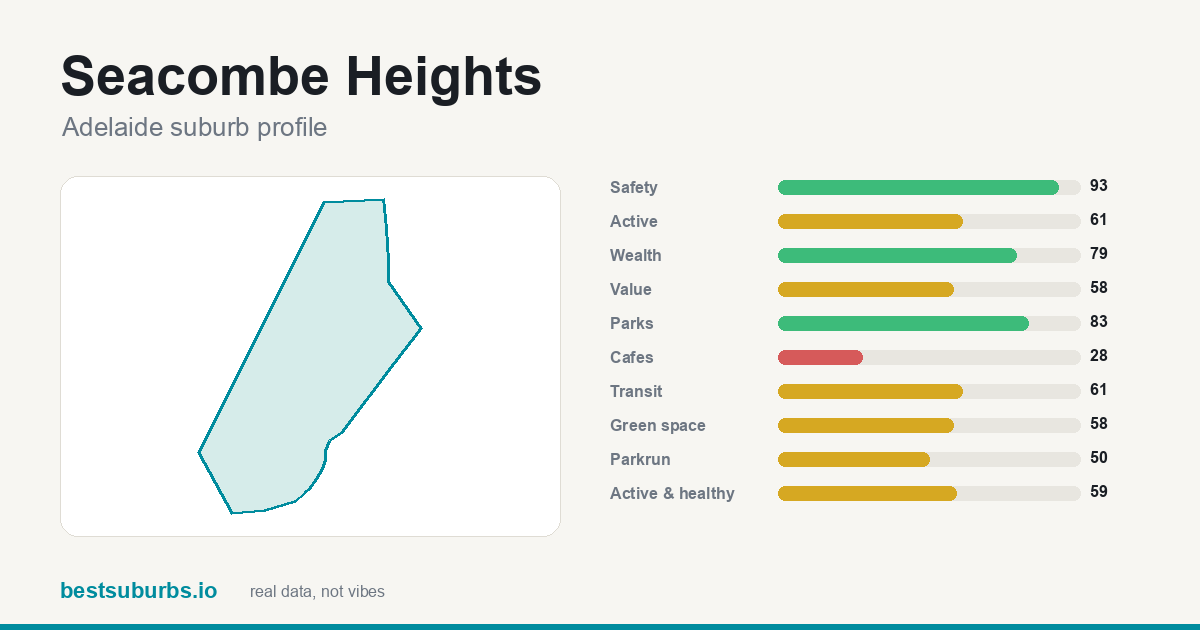 Seacombe Heights Seacombe Heights | 81 | 93 | 1 | 58 | 61 | $1,050,000 |
| 4 | 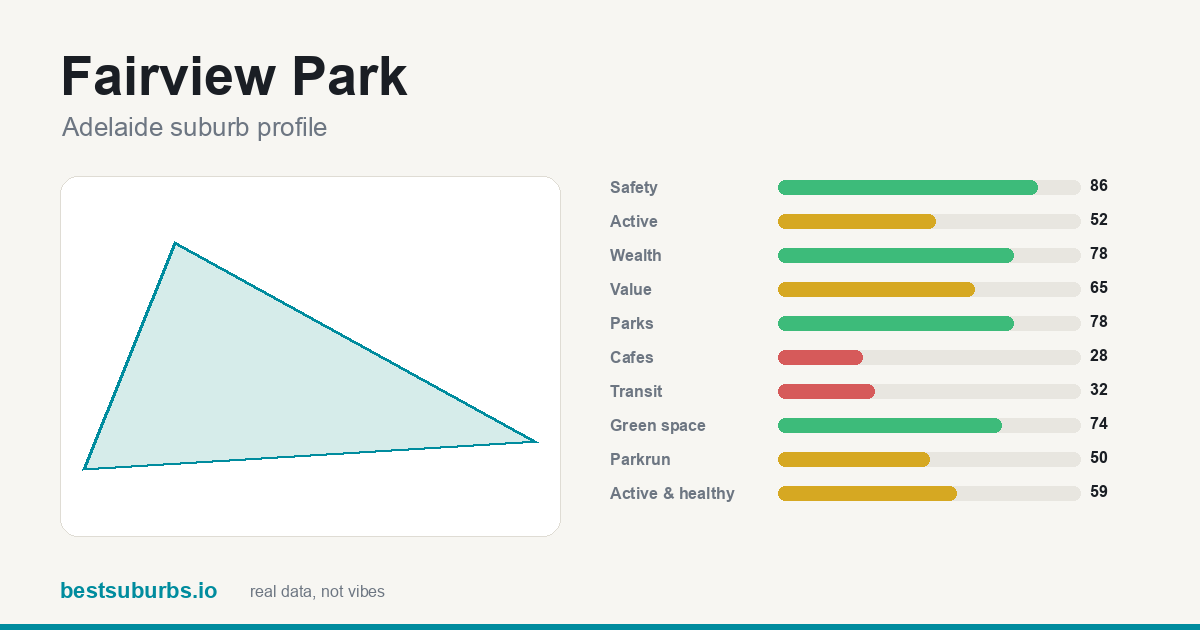 Fairview Park Fairview Park | 78 | 86 | 1 | 74 | 32 | $907,000 |
| 5 | 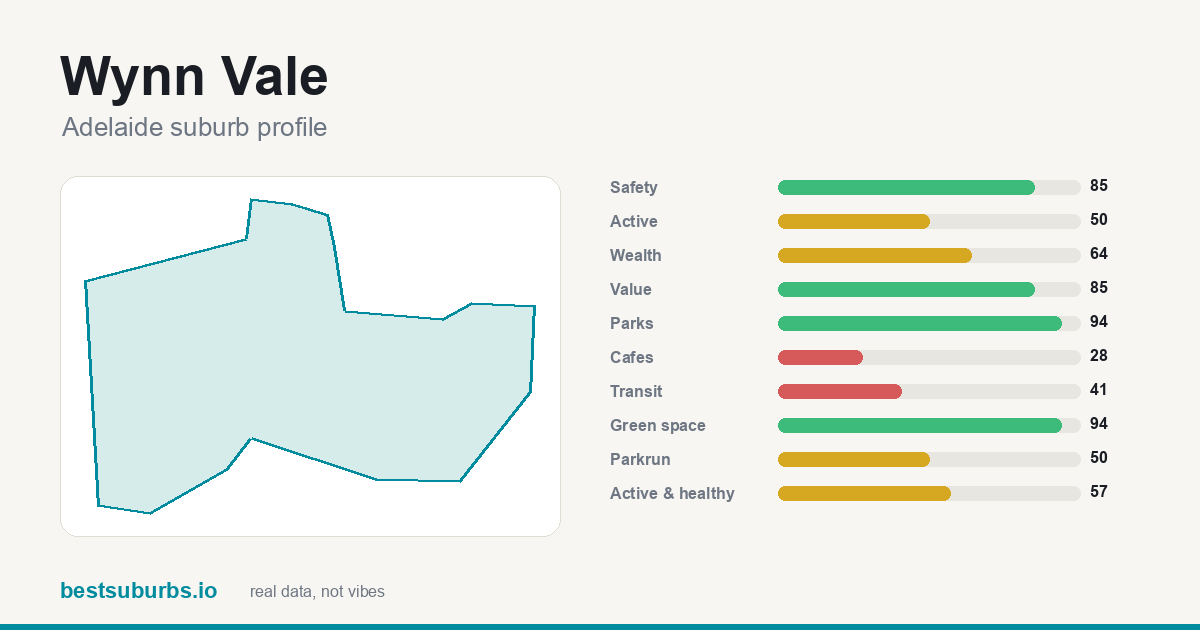 Wynn Vale Wynn Vale | 78 | 85 | 5 | 94 | 19 | $995,000 |
| 6 | 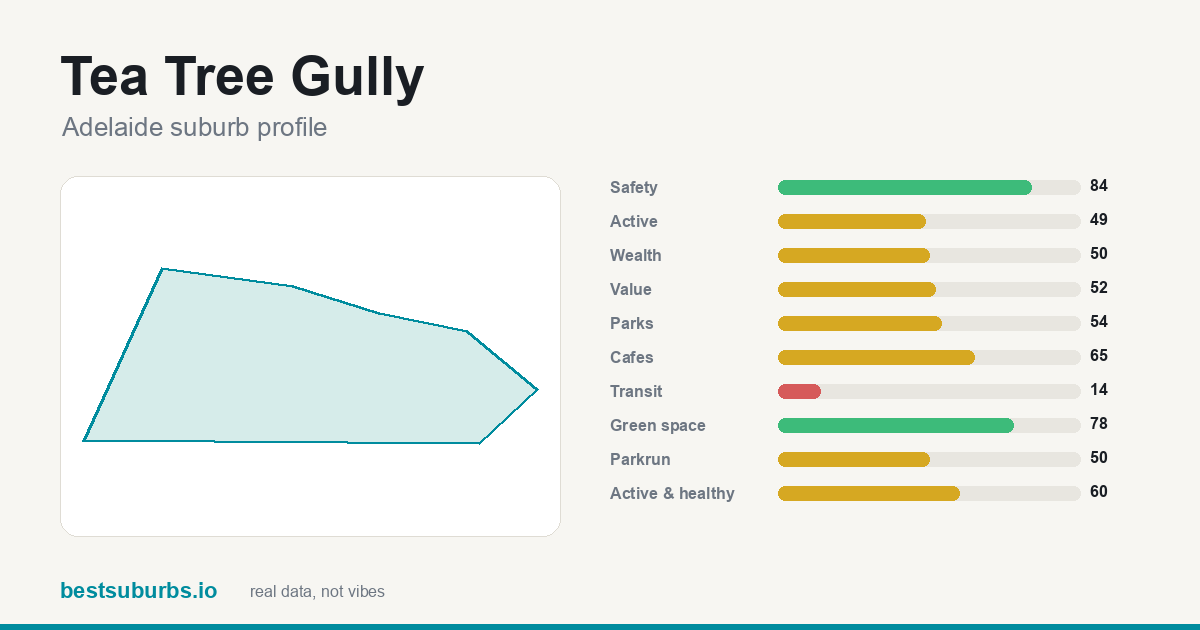 Tea Tree Gully Tea Tree Gully | 77 | 84 | 2 | 78 | 14 | $985,000 |
| 7 | 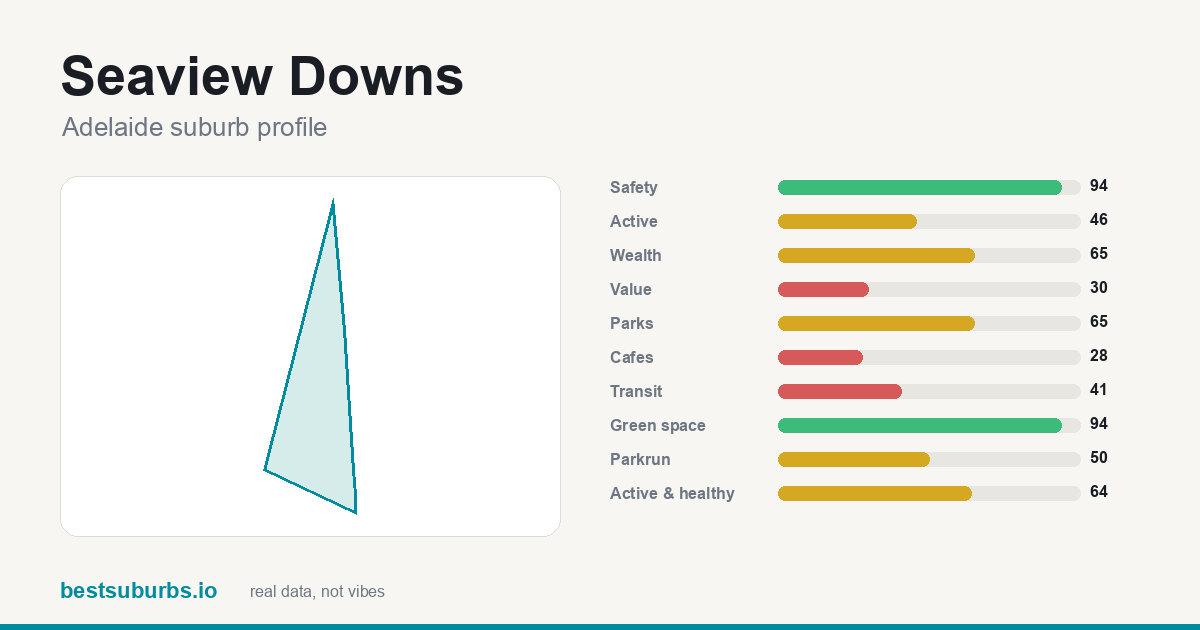 Seaview Downs Seaview Downs | 77 | 94 | 1 | 94 | 30 | $1,034,000 |
| 8 | 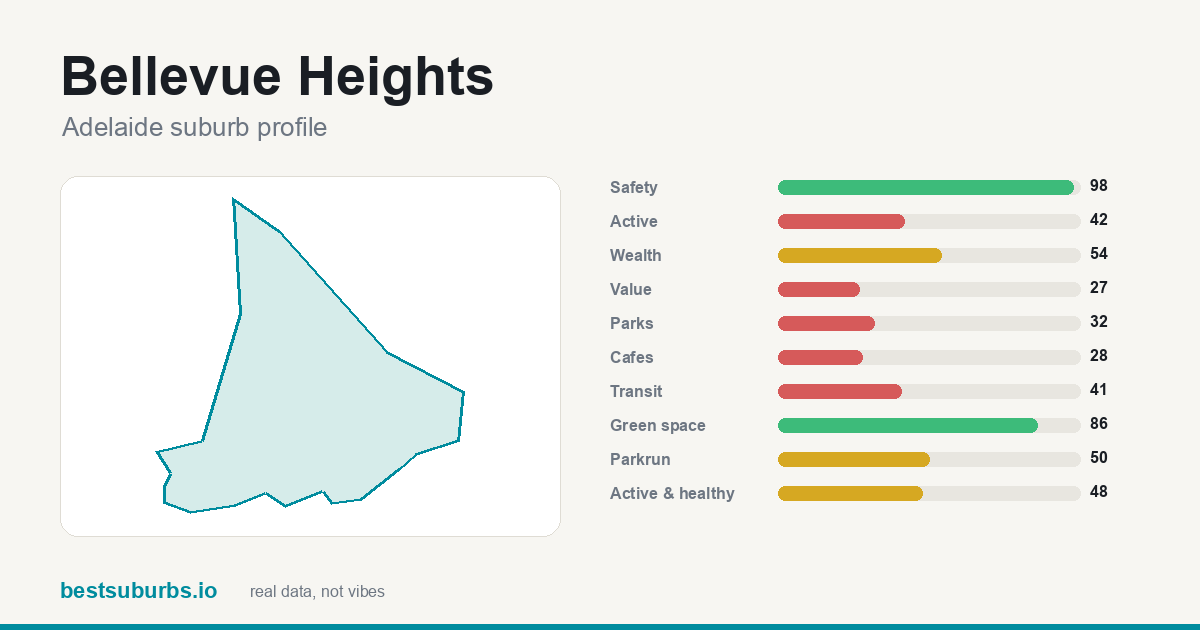 Bellevue Heights Bellevue Heights | 76 | 98 | 1 | 86 | 7 | $1,240,000 |
| 9 | 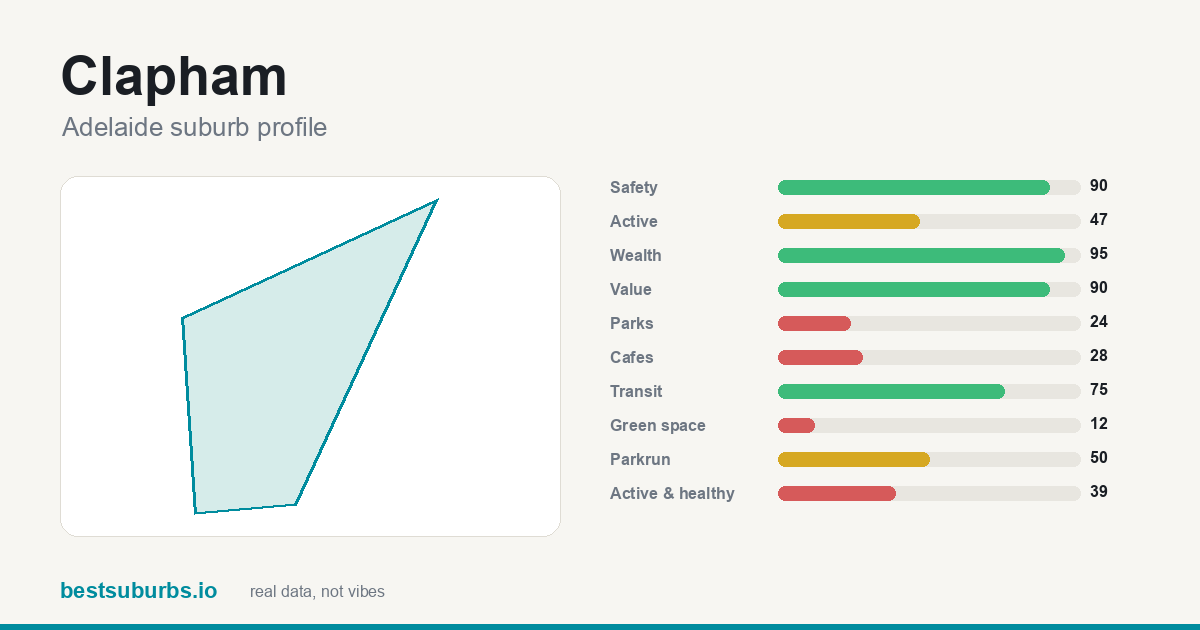 Clapham Clapham | 76 | 90 | 1 | 12 | 75 | $1,321,000 |
| 10 | 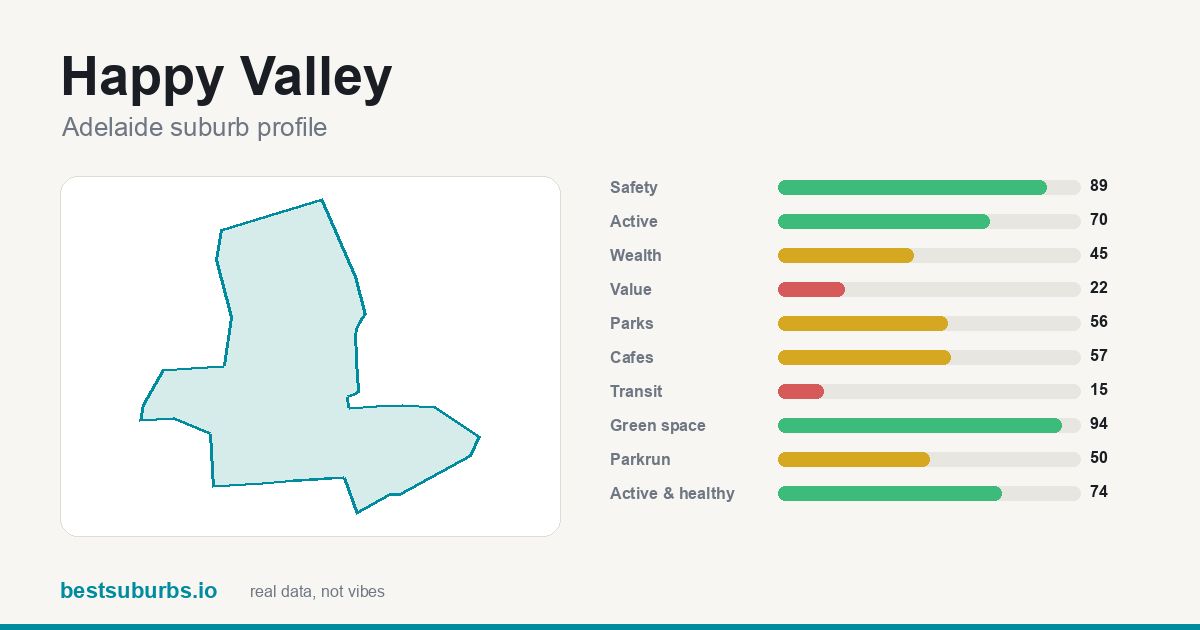 Happy Valley Happy Valley | 75 | 89 | 2 | 94 | 15 | $895,500 |
| 11 | 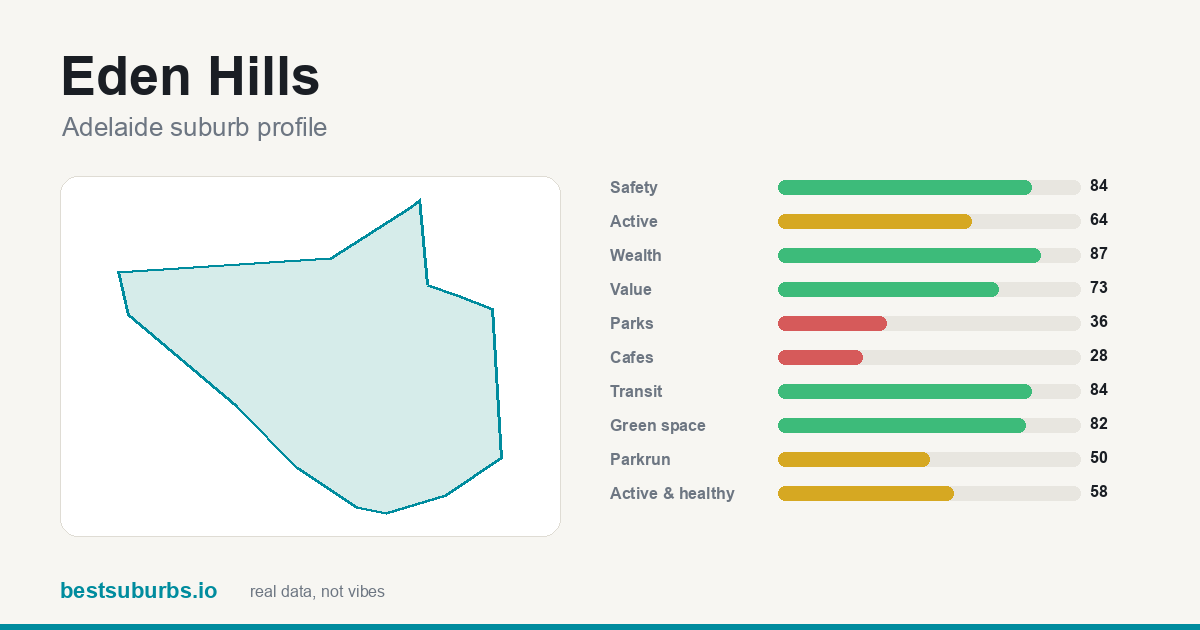 Eden Hills Eden Hills | 75 | 84 | 3 | 82 | 13 | $1,262,550 |
| 12 | 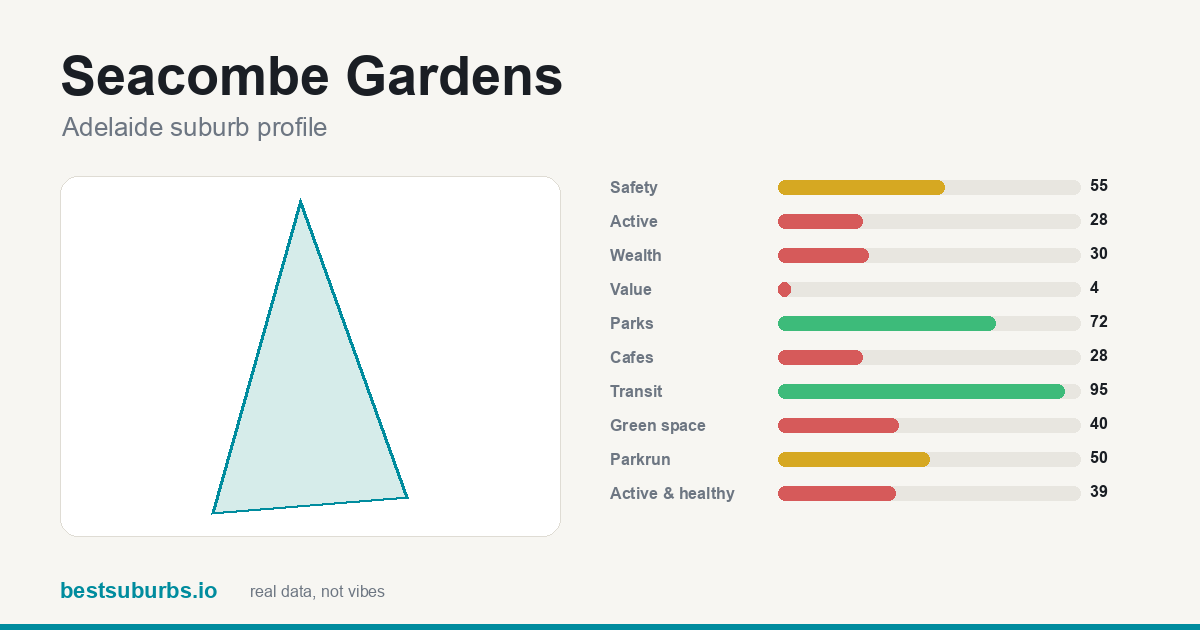 Seacombe Gardens Seacombe Gardens | 75 | 55 | 2 | 40 | 95 | $1,064,500 |
| 13 | 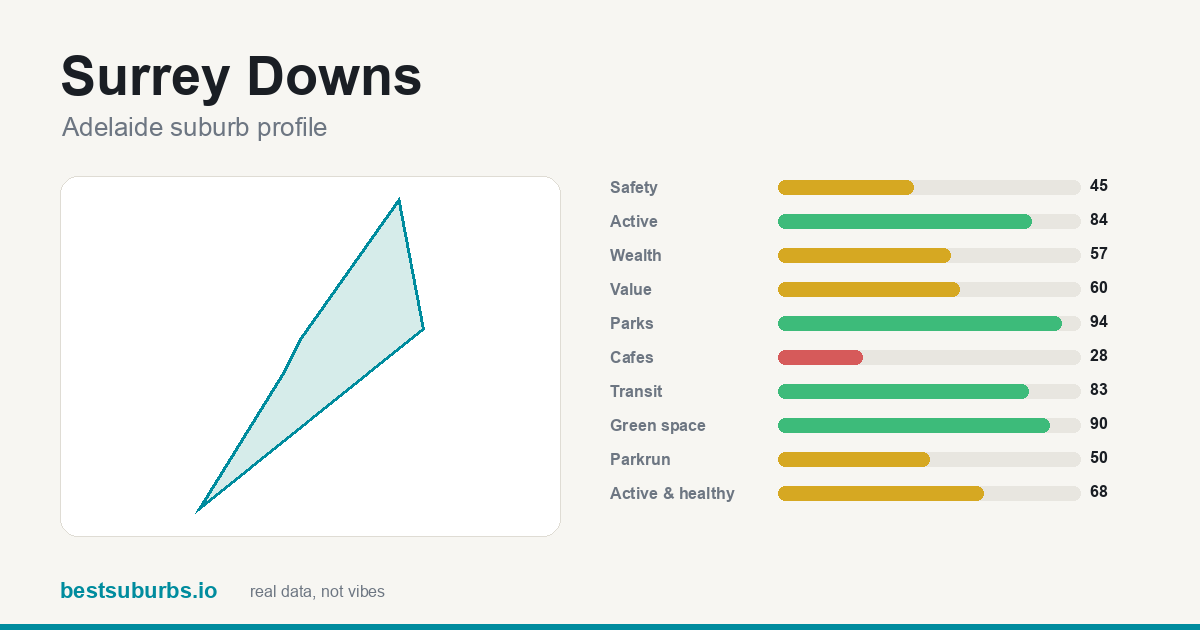 Surrey Downs Surrey Downs | 75 | 45 | 1 | 90 | 83 | $850,000 |
| 14 | 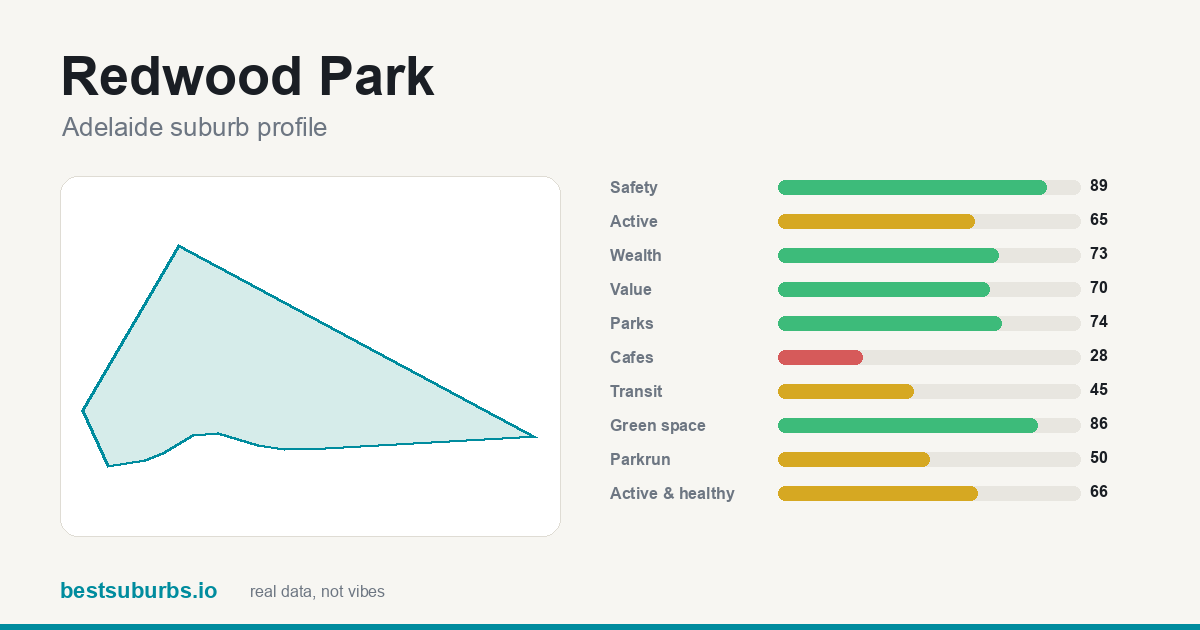 Redwood Park Redwood Park | 75 | 89 | 1 | 86 | 45 | $900,000 |
| 15 | 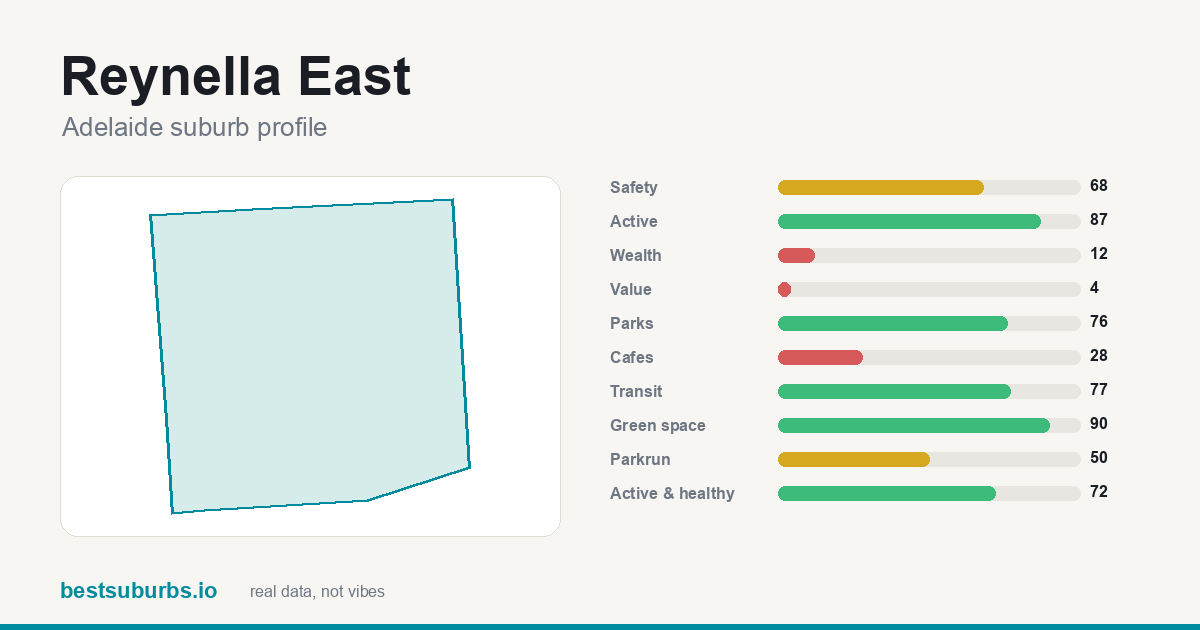 Reynella East Reynella East | 73 | 68 | 1 | 90 | 77 | $805,000 |
| 16 | 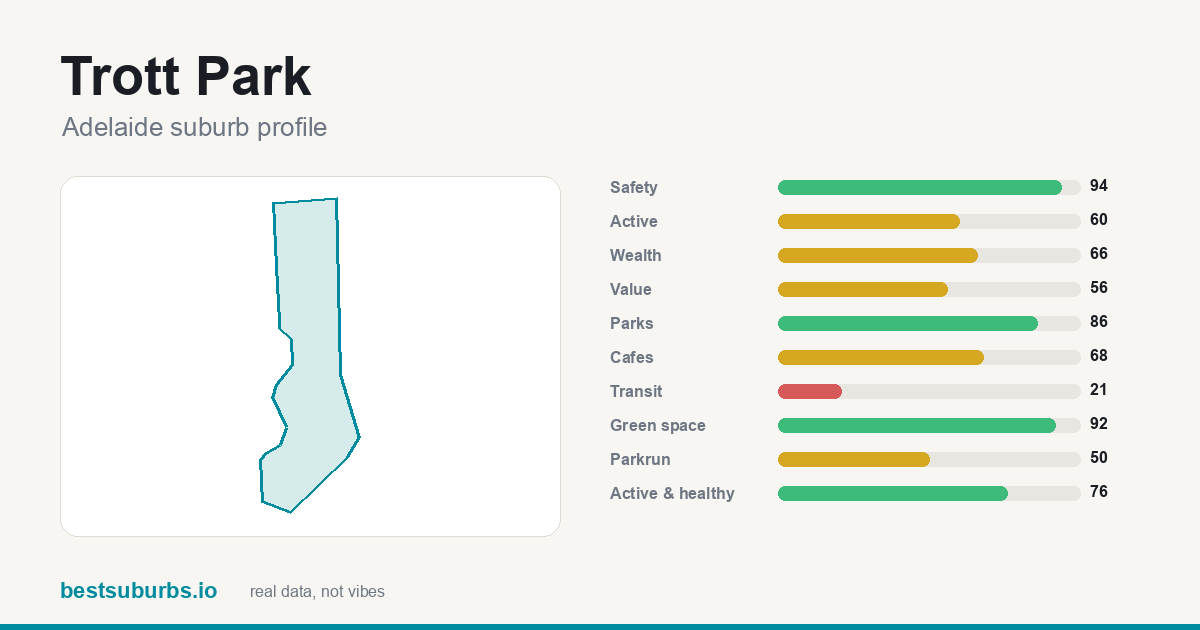 Trott Park Trott Park | 73 | 94 | 0 | 92 | 21 | $885,000 |
| 17 | 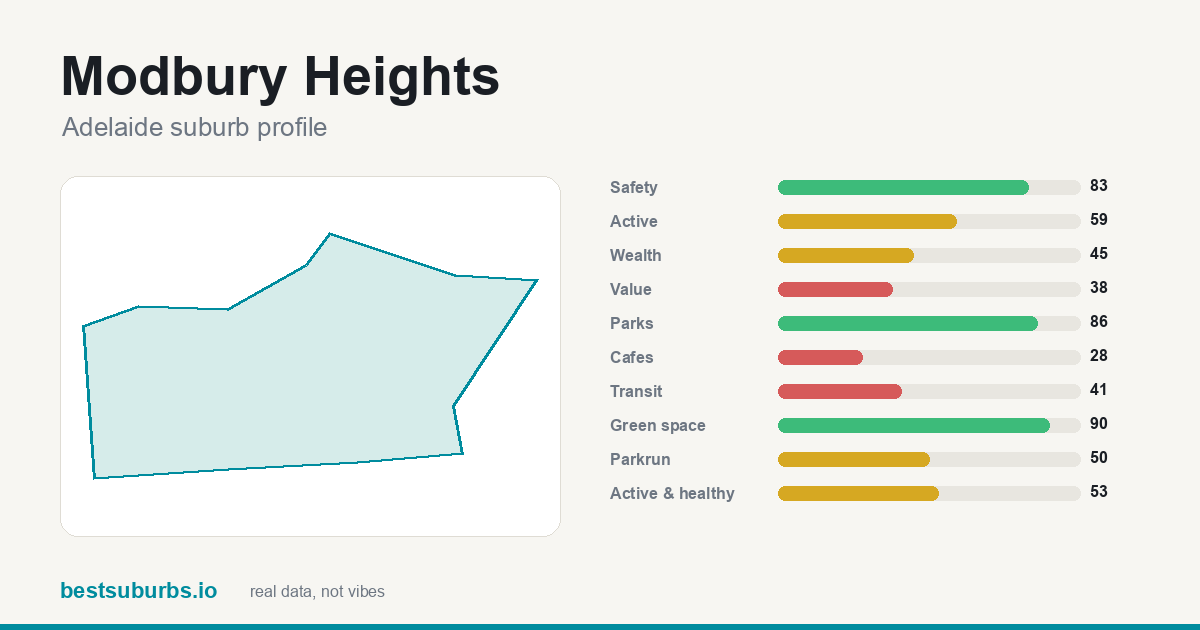 Modbury Heights Modbury Heights | 73 | 83 | 1 | 90 | 52 | $939,000 |
| 18 | 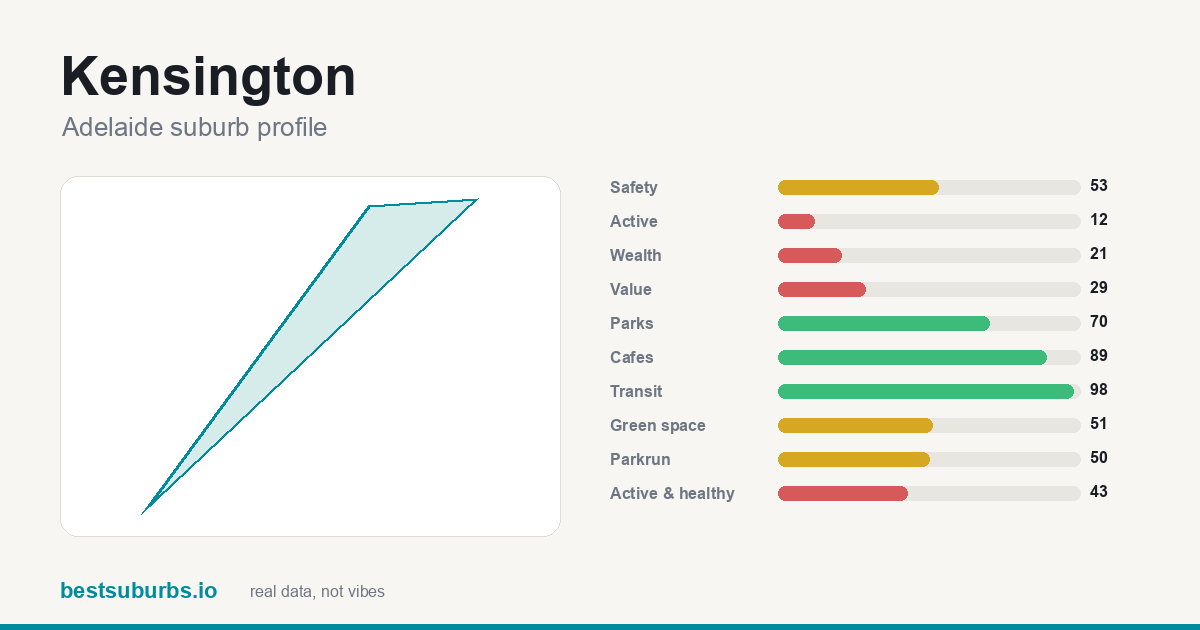 Kensington Kensington | 73 | 53 | 1 | 51 | 98 | $1,273,750 |
| 19 | 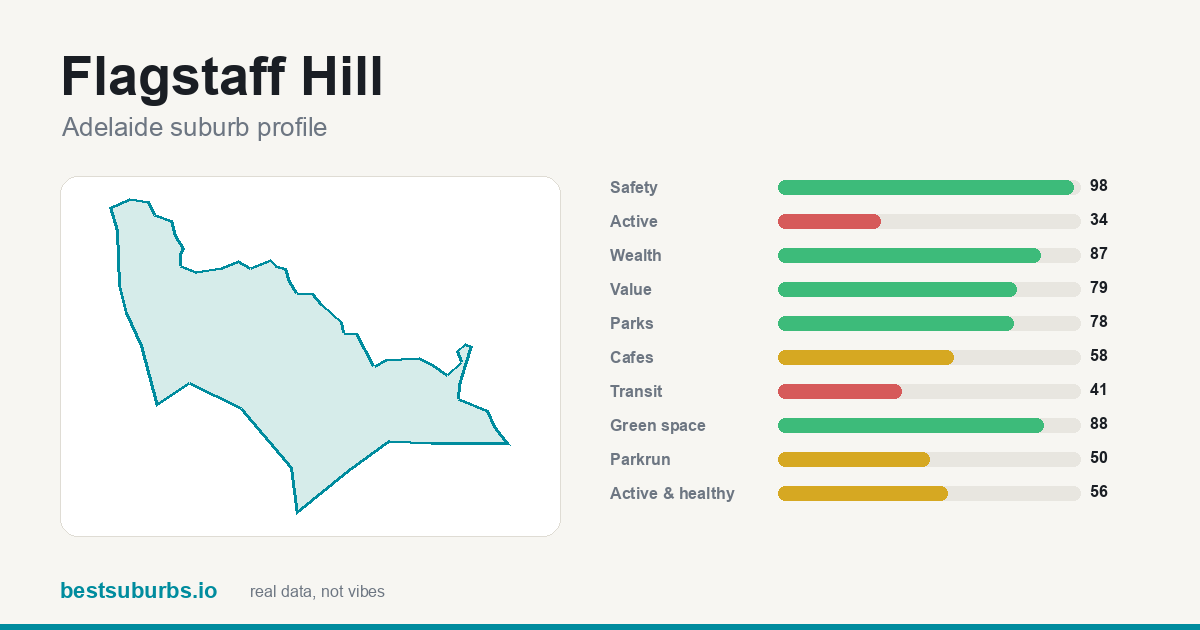 Flagstaff Hill Flagstaff Hill | 72 | 98 | 2 | 88 | 11 | $1,066,000 |
| 20 | 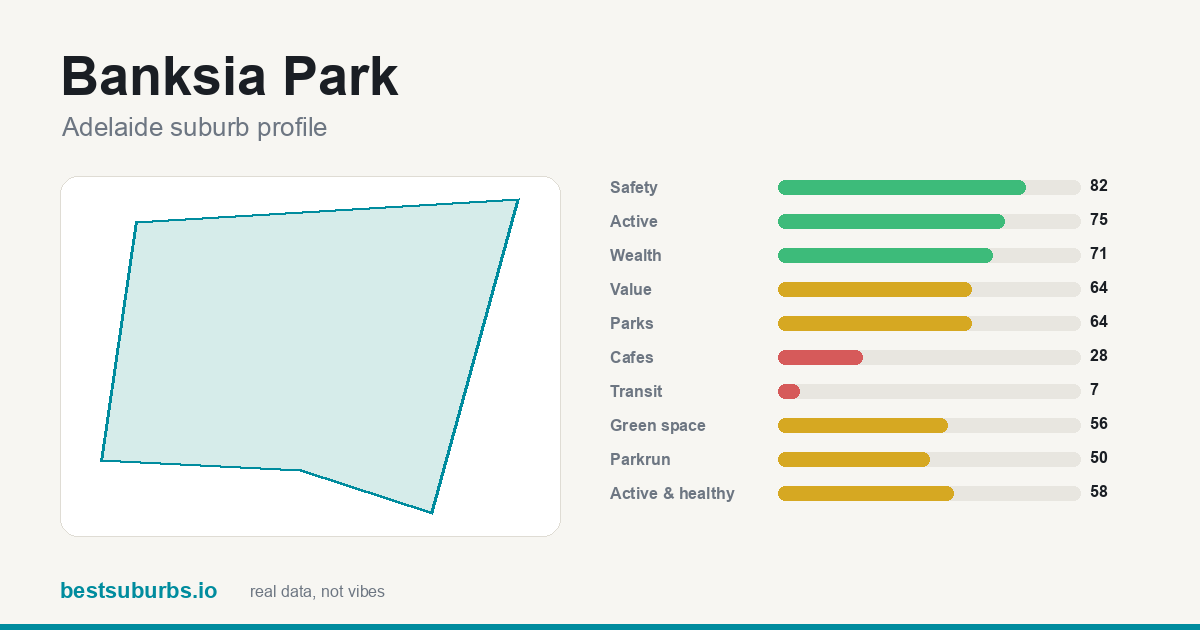 Banksia Park Banksia Park | 72 | 82 | 2 | 56 | 7 | $875,000 |
| 21 | 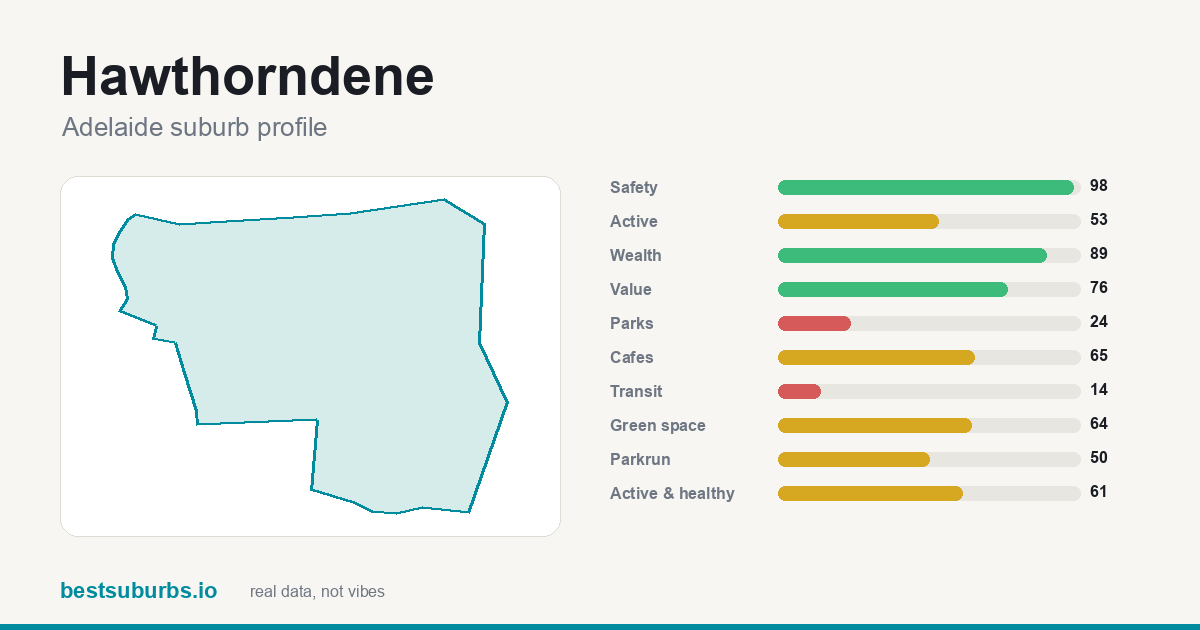 Hawthorndene Hawthorndene | 72 | 98 | 1 | 64 | 14 | $1,140,000 |
| 22 | 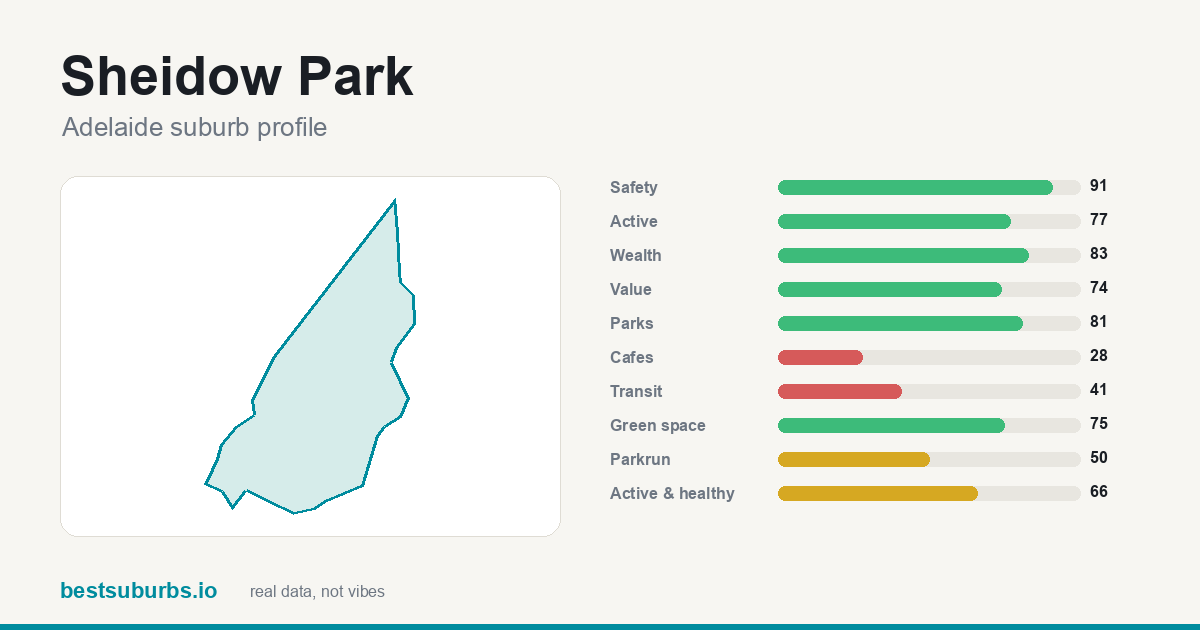 Sheidow Park Sheidow Park | 72 | 91 | 3 | 75 | 30 | $940,000 |
| 23 | 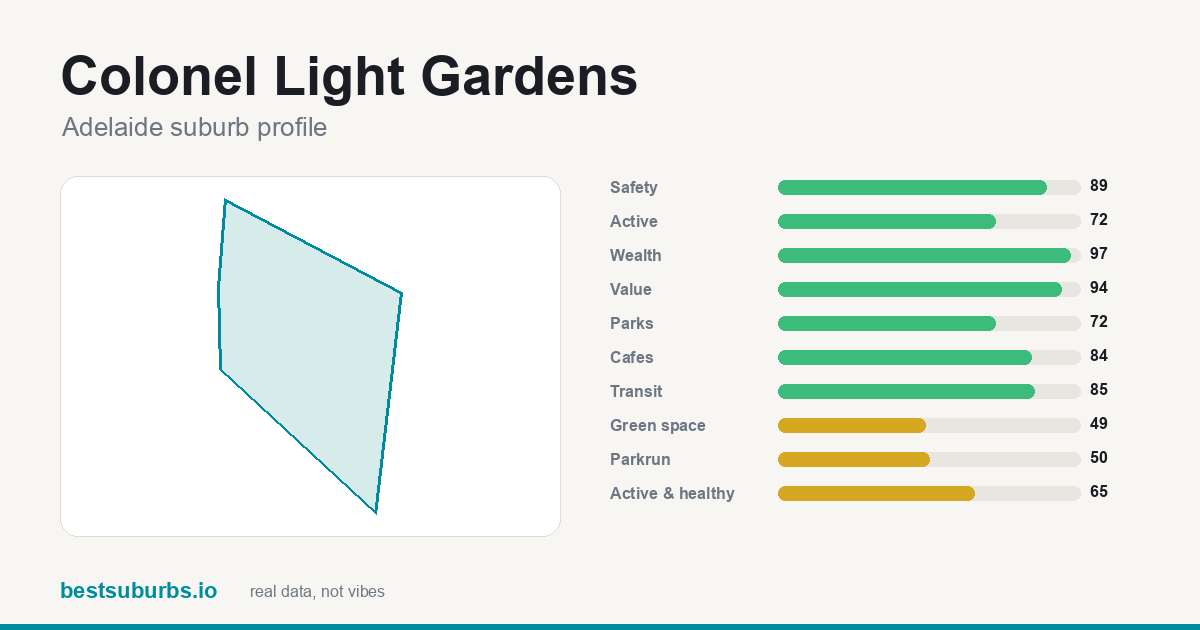 Colonel Light Gardens Colonel Light Gardens | 72 | 89 | 2 | 49 | 85 | $1,668,000 |
| 24 | 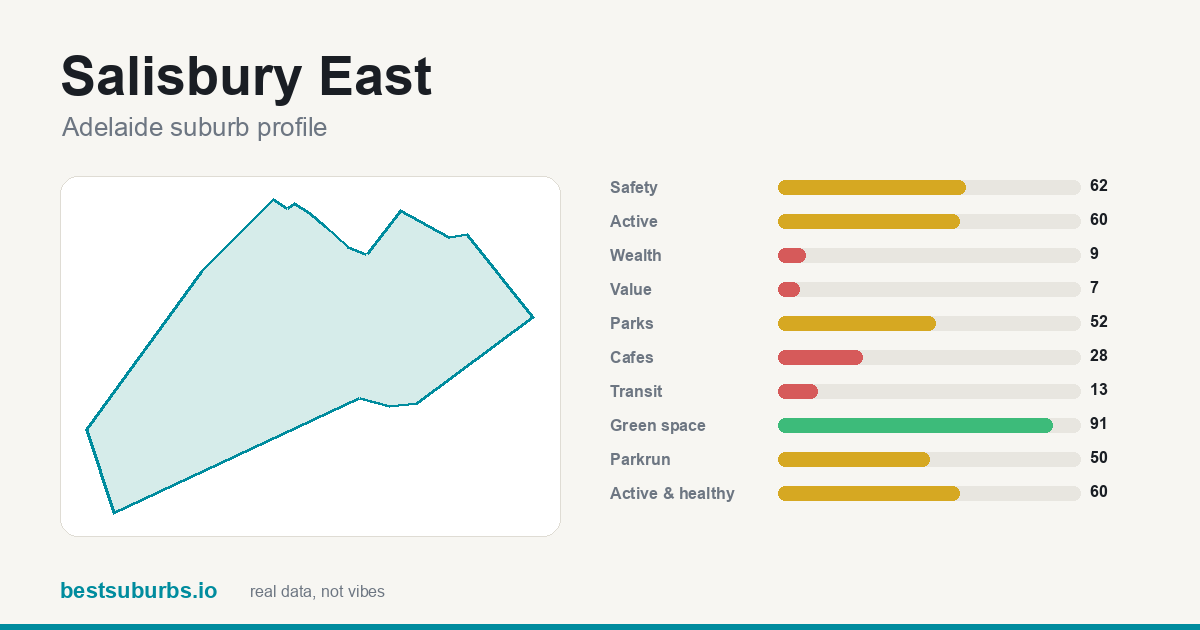 Salisbury East Salisbury East | 72 | 62 | 4 | 91 | 13 | $820,000 |
| 25 | 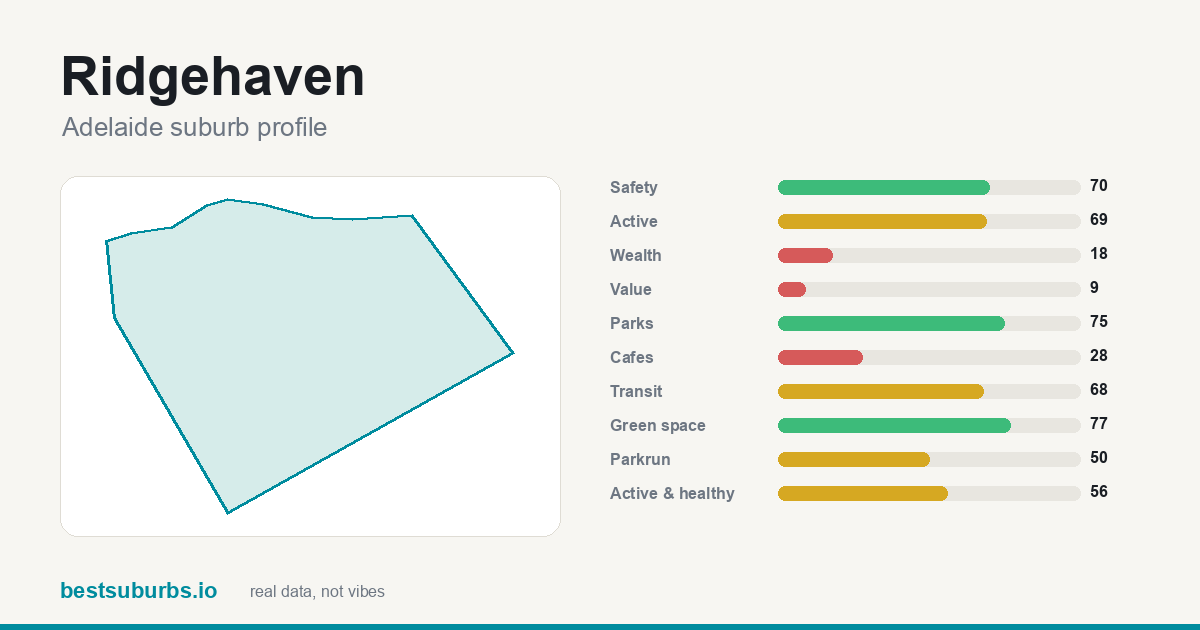 Ridgehaven Ridgehaven | 72 | 70 | 1 | 77 | 68 | $895,000 |
Showing the top 25 of 274 ranked suburbs. Scores are percentiles against every other suburb in Adelaide: 100 is the best in the city, 50 is mid-table. Click any suburb for its full profile.
Why are these the 10 best Adelaide suburbs for families? (October 2026)
Updated 17 October 2026 · one sentence of real reasons per suburb, from the data on this page.
- Aberfoyle Park ★ 84
#1 Aberfoyle Park — a recorded crime rate of about 21 offences per 1,000 residents (safety score 84/100), plus 98% of it within 400 m of a park, and 6 government primary schools and 1 secondary inside the suburb.
- Glenalta ★ 82
#2 Glenalta — a recorded crime rate of about 4 offences per 1,000 residents (safety score 100/100), plus 100% of it within 400 m of a park, and 37 public transport stops inside it for a transit score of 93.
- Seacombe Heights ★ 81
At #3, Seacombe Heights combines a recorded crime rate of about 14 offences per 1,000 residents (safety score 93/100) and 88% of it within 400 m of a park, and 1 secondary inside the suburb.
- Fairview Park ★ 78
At #4, Fairview Park combines a recorded crime rate of about 19 offences per 1,000 residents (safety score 86/100) and 95% of it within 400 m of a park, and 1 government primary school inside the suburb.
- Wynn Vale ★ 78
At #5, Wynn Vale combines a recorded crime rate of about 20 offences per 1,000 residents (safety score 85/100) and 100% of it within 400 m of a park, and 5 government primary schools inside the suburb.
- Tea Tree Gully ★ 77
Tea Tree Gully takes #6 on a recorded crime rate of about 21 offences per 1,000 residents (safety score 84/100), with 86% of it within 400 m of a park, and 2 government primary schools inside the suburb.
- Seaview Downs ★ 77
Seaview Downs ranks #7: a recorded crime rate of about 13 offences per 1,000 residents (safety score 94/100), 100% of it within 400 m of a park, and 36.1 ha of parkland per 1,000 residents.
- Bellevue Heights ★ 76
Bellevue Heights ranks #8: a recorded crime rate of about 7 offences per 1,000 residents (safety score 98/100), 96% of it within 400 m of a park, and 21.8 ha of parkland per 1,000 residents.
- Clapham ★ 76
What lifts Clapham to #9 is a recorded crime rate of about 17 offences per 1,000 residents (safety score 90/100); it also has 11 public transport stops inside it for a transit score of 75, and 1 government primary school inside the suburb.
- Happy Valley ★ 75
What lifts Happy Valley to #10 is a recorded crime rate of about 17 offences per 1,000 residents (safety score 89/100); it also has 99% of it within 400 m of a park, and 60.9 ha of parkland per 1,000 residents.
Why each of the top 10 suburbs for families in Adelaide ranks where it does
Written from this page's own data: each figure below is the suburb's own value, set against the Adelaide median where we hold one.
1. Aberfoyle Park
Aberfoyle Park is #1 of 274 ranked Adelaide suburbs on this list, with a score of 84/100. Its strongest family components are schools 95, house price for the size 94, green space 90 (each out of 100). The trade-off: it scores 37/100 for public transport, so it is weaker there. It covers 5.8 km² with about 11,234 residents (census).
2. Glenalta
Glenalta is #2 of 274 ranked Adelaide suburbs on this list, with a score of 82/100. Its strongest family components are safety 100, kinders and childcare 96, public transport 93 (each out of 100). The trade-off: it scores 21/100 for activity, so it is weaker there. It covers 1.2 km² with about 2,039 residents (census).
3. Seacombe Heights
Seacombe Heights is #3 of 274 ranked Adelaide suburbs on this list, with a score of 81/100. Its strongest family components are schools 93, safety 93, house price for the size 82 (each out of 100). The trade-off: it scores 28/100 for cafés, so it is weaker there. It covers 0.8 km² with about 1,549 residents (census).
4. Fairview Park
Fairview Park is #4 of 274 ranked Adelaide suburbs on this list, with a score of 78/100. Its strongest family components are house price for the size 98, kinders and childcare 87, safety 86 (each out of 100). The trade-off: it scores 28/100 for cafés, so it is weaker there. It covers 2.1 km² with about 3,792 residents (census).
5. Wynn Vale
Wynn Vale is #5 of 274 ranked Adelaide suburbs on this list, with a score of 78/100. Its strongest family components are schools 96, green space 96, house price for the size 88 (each out of 100). The trade-off: it scores 19/100 for public transport, so it is weaker there. It covers 4.3 km² with about 7,865 residents (census).
6. Tea Tree Gully
Tea Tree Gully is #6 of 274 ranked Adelaide suburbs on this list, with a score of 77/100. Its strongest family components are schools 90, kinders and childcare 89, house price for the size 89 (each out of 100). The trade-off: it scores 14/100 for public transport, so it is weaker there. It covers 3.7 km² with about 3,499 residents (census).
7. Seaview Downs
Seaview Downs is #7 of 274 ranked Adelaide suburbs on this list, with a score of 77/100. Its strongest family components are safety 94, green space 86, schools 84 (each out of 100). The trade-off: it scores 28/100 for cafés, so it is weaker there. It covers 2.3 km² with about 2,718 residents (census).
8. Bellevue Heights
Bellevue Heights is #8 of 274 ranked Adelaide suburbs on this list, with a score of 76/100. Its strongest family components are safety 98, kinders and childcare 95, schools 83 (each out of 100). The trade-off: it scores 7/100 for public transport, so it is weaker there. It covers 2.5 km² with about 2,712 residents (census).
9. Clapham
Clapham is #9 of 274 ranked Adelaide suburbs on this list, with a score of 76/100. Its strongest family components are kinders and childcare 99, schools 94, safety 90 (each out of 100). The trade-off: it scores 24/100 for parks, so it is weaker there. It covers 0.7 km² with about 1,685 residents (census).
10. Happy Valley
Happy Valley is #10 of 274 ranked Adelaide suburbs on this list, with a score of 75/100. Its strongest family components are house price for the size 99, safety 89, green space 84 (each out of 100). The trade-off: it scores 15/100 for public transport, so it is weaker there. It covers 13.3 km² with about 11,420 residents (census).
How do these suburbs compare head to head?
What else do people ask about suburbs for families in Adelaide?
What are the best suburbs in Adelaide for families?
On our October 2026 data the top five are Aberfoyle Park (84/100), Glenalta (82/100), Seacombe Heights (81/100), Fairview Park (78/100), Wynn Vale (78/100), out of 274 ranked Adelaide suburbs.
How is this ranking calculated?
Families score v2 (10 September 2026): safety 30%, schools 25% (schools per 1,000 residents from government school-location data where available, plus a primary within 800 m and a secondary within 2 km), parks and green space per 1,000 residents 15%, kinders and childcare per 1,000 10%, house price for the size 10% (median house price against the city median, gently), and public transport 10%. Weights are renormalised where a city lacks a component. v1 penalised dense inner suburbs for park hectares and leaned on OpenStreetMap school points; see the honesty note below. 274 of 274 Adelaide suburbs had enough data to be ranked. Updated October 2026.
Is this ranking sponsored?
No. No ranking on this site is sold or sponsored. It is computed from open data: GPS activity traces, official crime statistics, the ABS census and OpenStreetMap.
What other Adelaide rankings are there?
Sources: open GPS activity traces, official crime statistics, ABS census,
OpenStreetMap (ODbL). Sale prices: SA Government Metropolitan Median House Sales, April–June 2026 quarter (2Q 2026) — © Government of South Australia (Land Services SA), Metropolitan Median House Sales, CC BY 4.0. Quarterly median house sale price per suburb, metropolitan Adelaide. Units are not in this dataset. Figures marked as low-volume rest on fewer than 10 sales that quarter. No ranking on this site is sold or sponsored.
← all 274 Adelaide suburbs, with sliders