Healthiest, most active suburbs in Adelaide
Where people genuinely walk, run and ride — measured, not claimed.
O'Halloran Hill (88/100), North Adelaide (88/100), Adelaide (86/100) lead this ranking of 274 Adelaide suburbs.
By BestSuburbs research · Updated October 2026
Part of Adelaide suburb rankings · all Adelaide lists
Which Adelaide suburbs are the healthiest and most active?
How do the top 25 compare, measure by measure?
| # | Suburb | Activity heat / km² | Gyms + sport per 1,000 | Healthy score | Median house price |
|---|---|---|---|---|---|
| 1 | 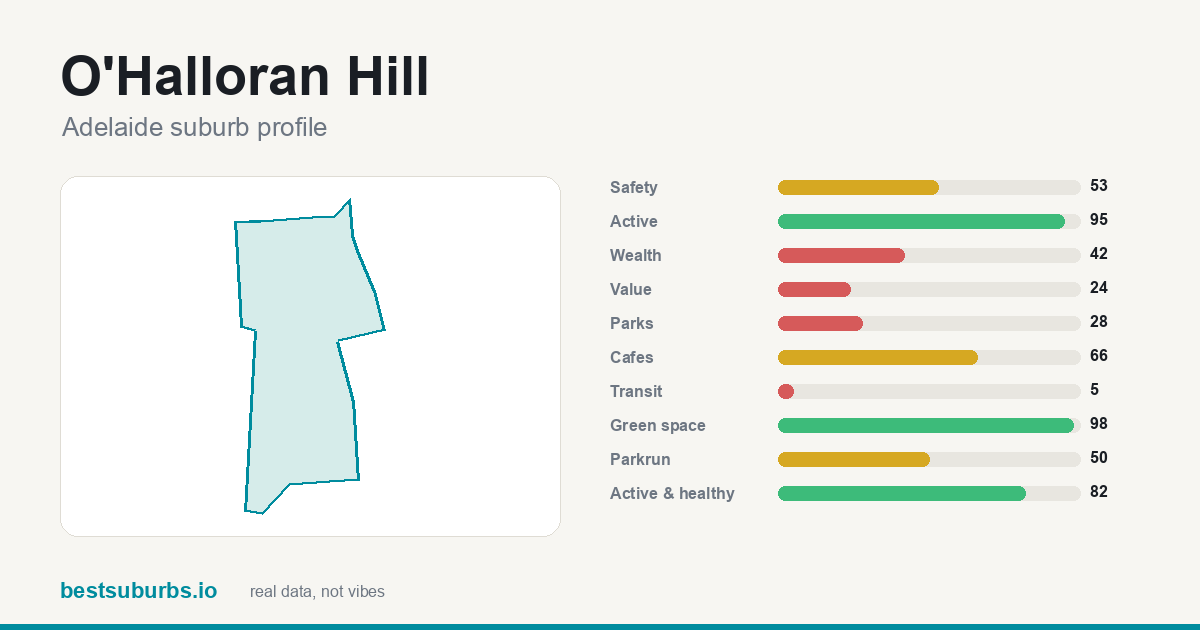 O'Halloran Hill O'Halloran Hill | — | 29.4 | 82 | $880,000 |
| 2 | 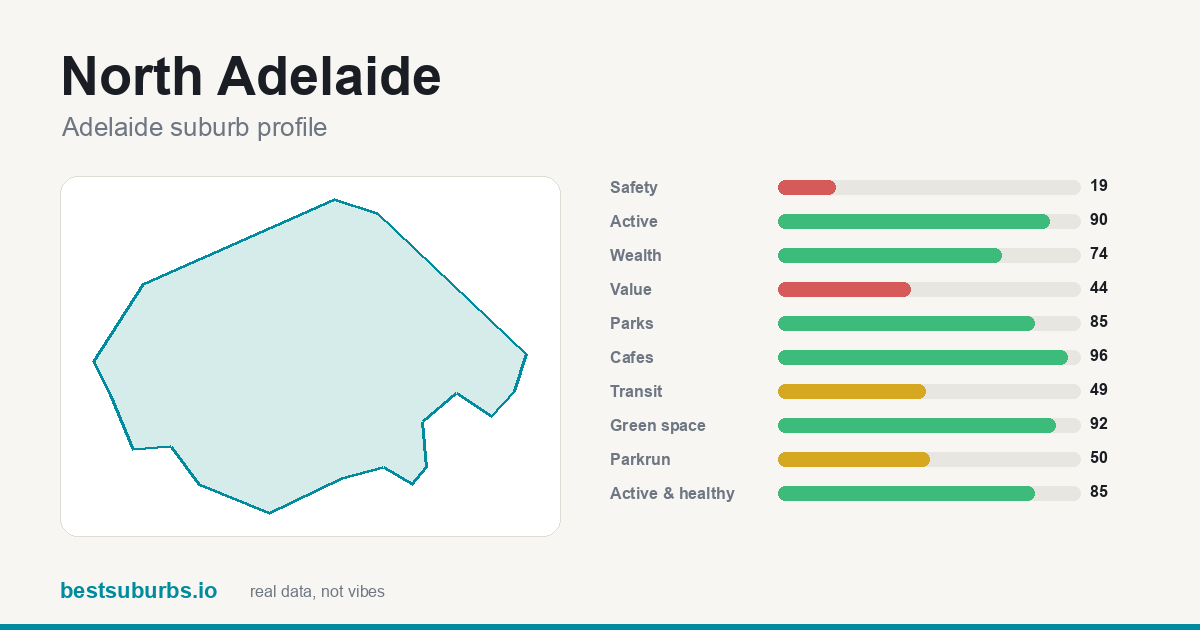 North Adelaide North Adelaide | — | 28.9 | 85 | $4,270,000 |
| 3 | 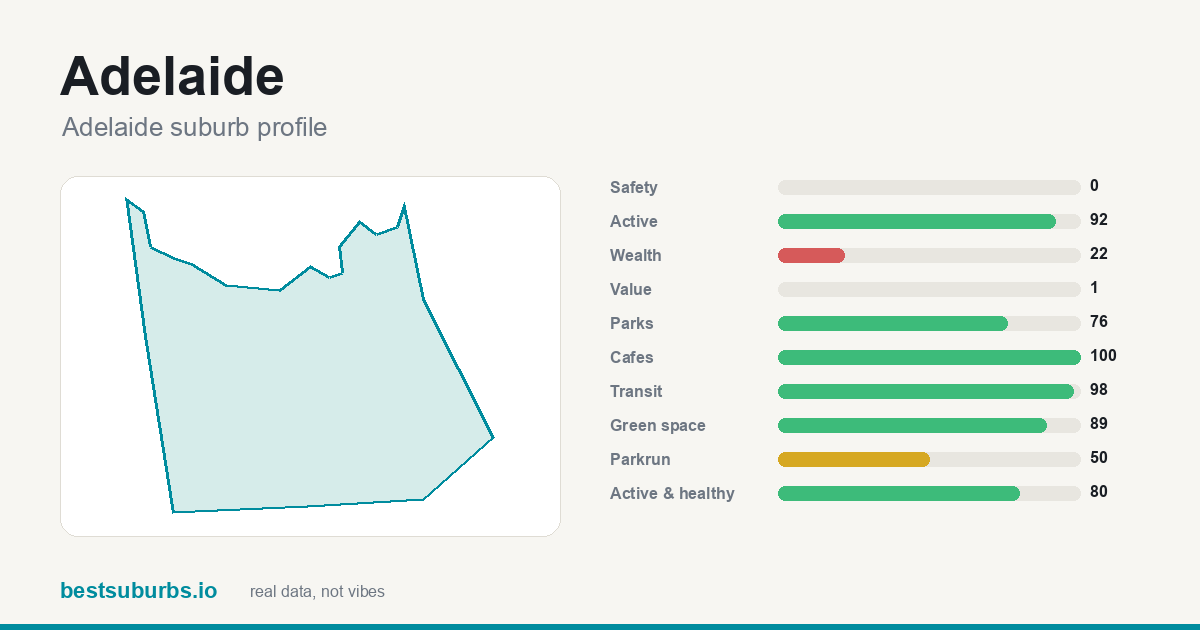 Adelaide Adelaide | — | 11.1 | 80 | $1,555,000 |
| 4 | 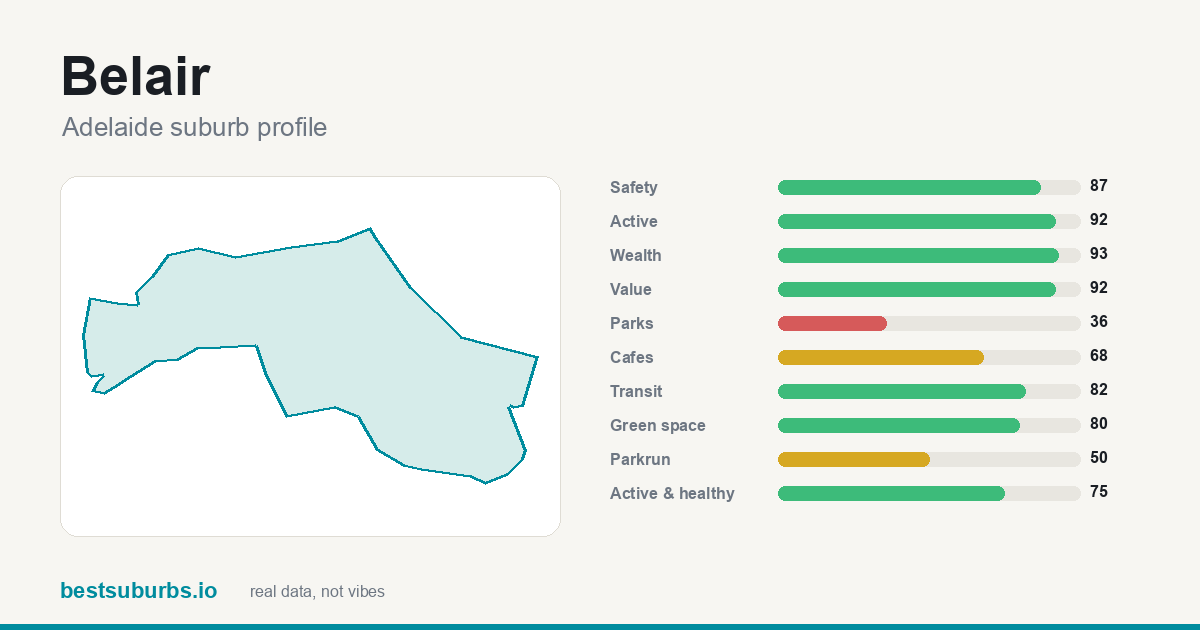 Belair Belair | — | 14.4 | 75 | $1,455,000 |
| 5 | 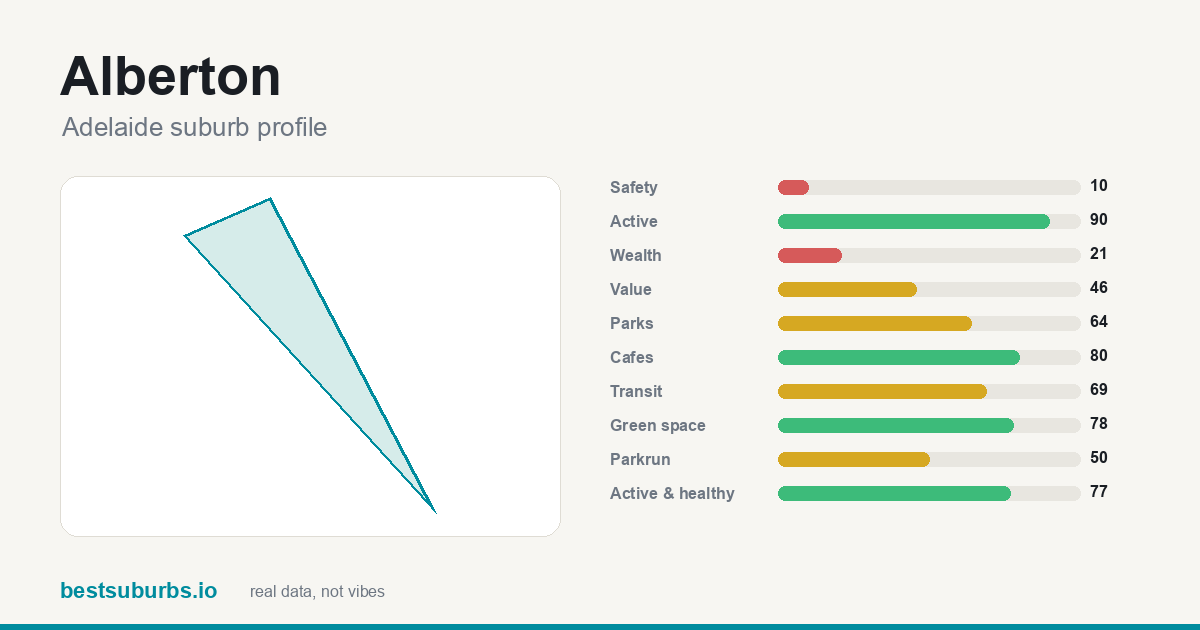 Alberton Alberton | — | 17.7 | 77 | $1,550,000 |
| 6 | 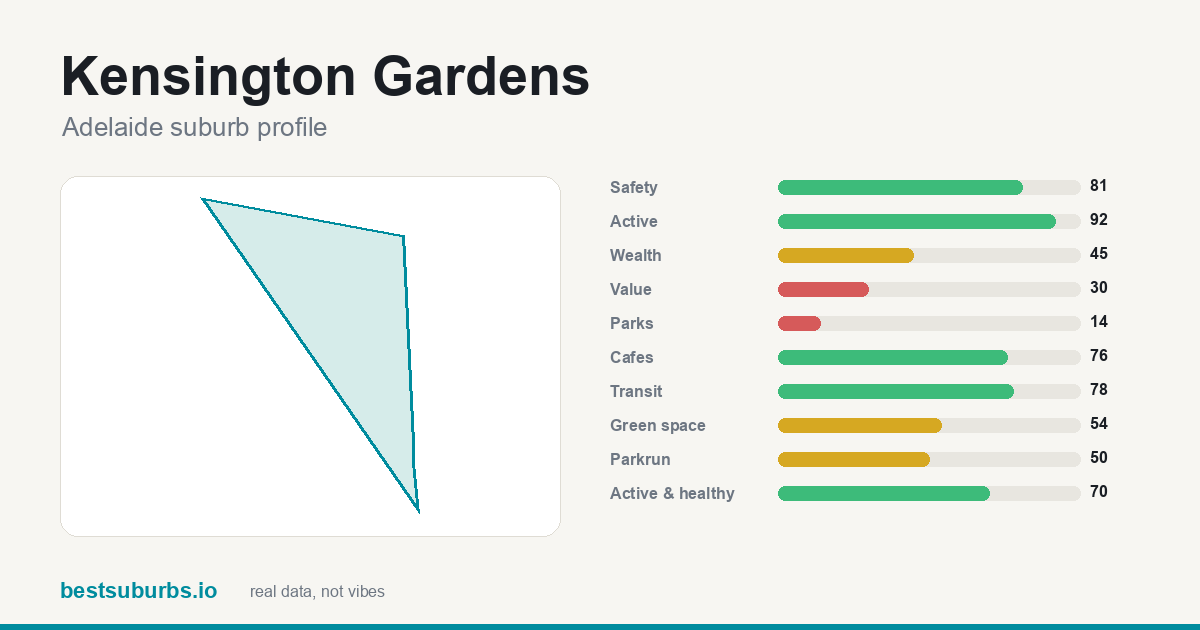 Kensington Gardens Kensington Gardens | — | 18.8 | 70 | $2,265,000 |
| 7 | 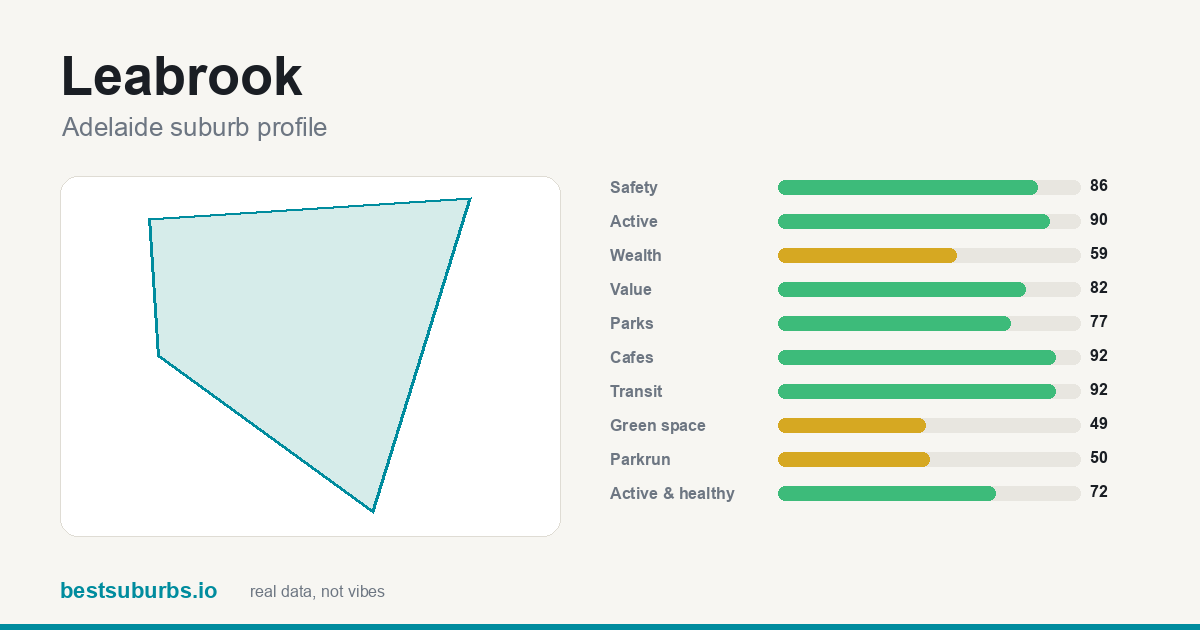 Leabrook Leabrook | — | 21.2 | 72 | $1,997,500 |
| 8 | 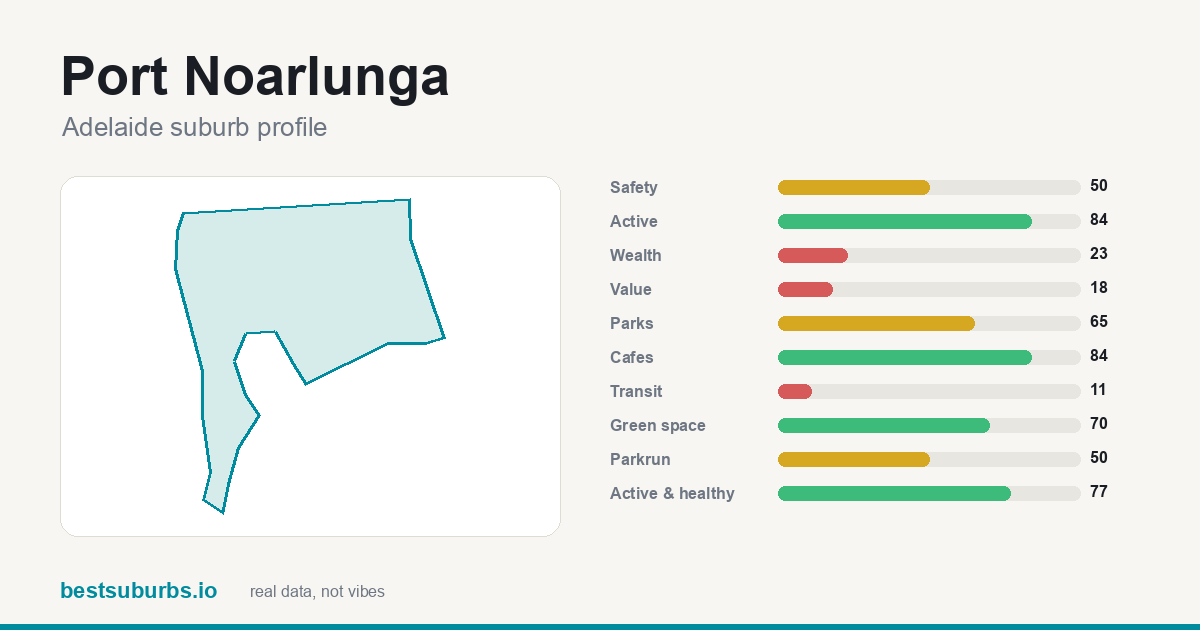 Port Noarlunga Port Noarlunga | — | 19.1 | 77 | $957,500 |
| 9 | 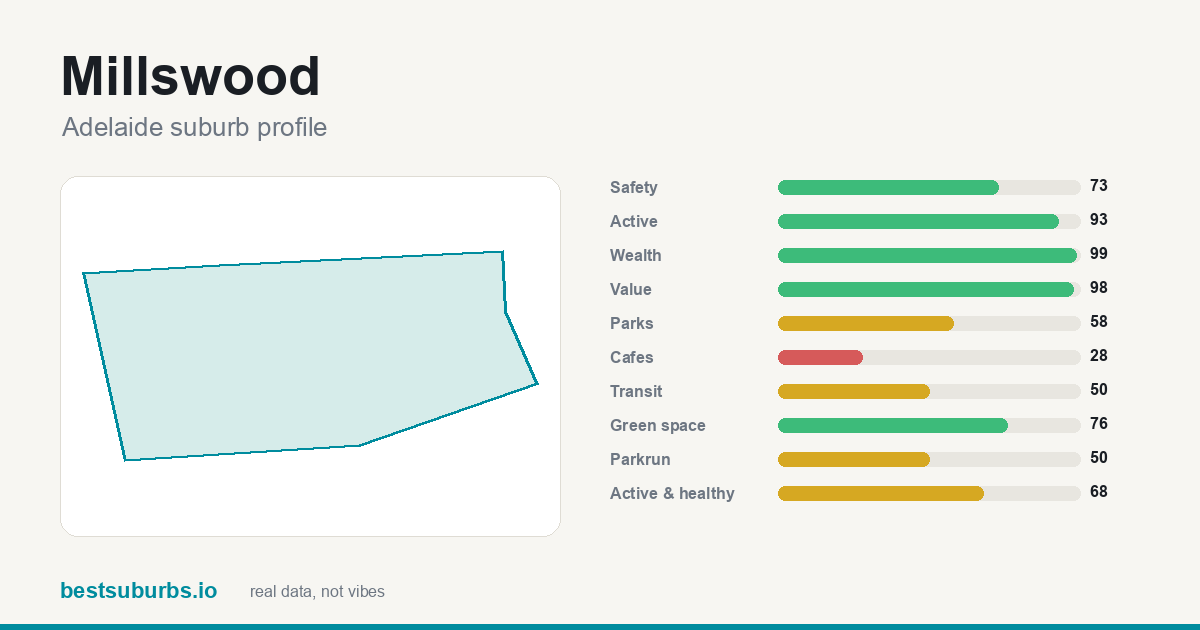 Millswood Millswood | — | 19.3 | 68 | $1,820,000 |
| 10 | 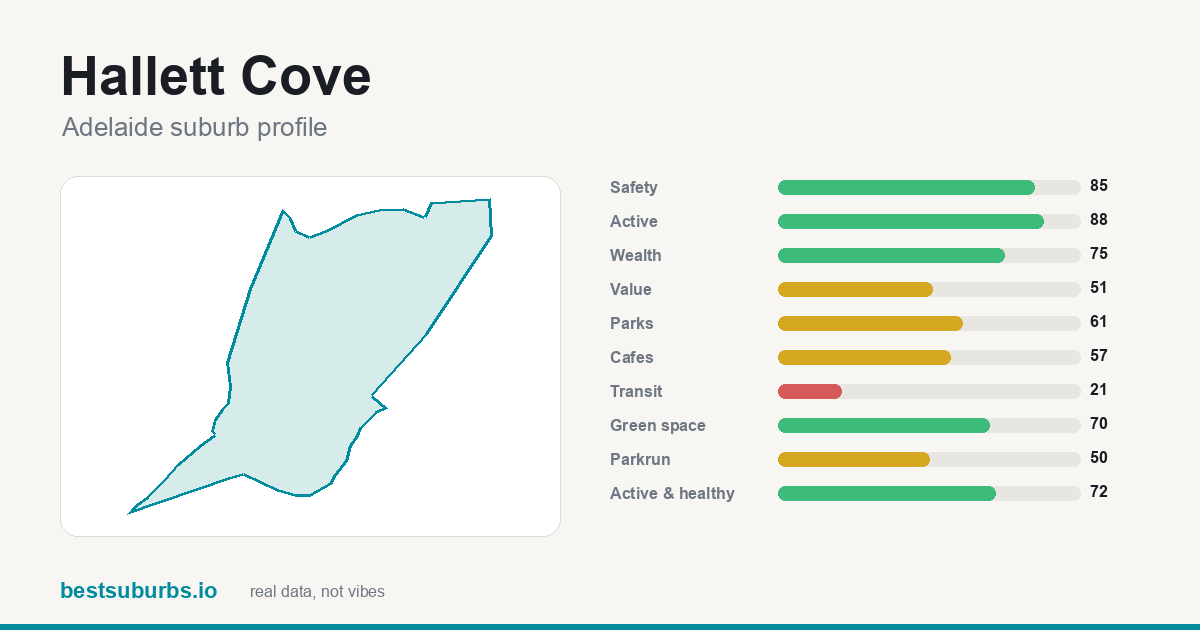 Hallett Cove Hallett Cove | — | 24.6 | 72 | $1,000,000 |
| 11 | 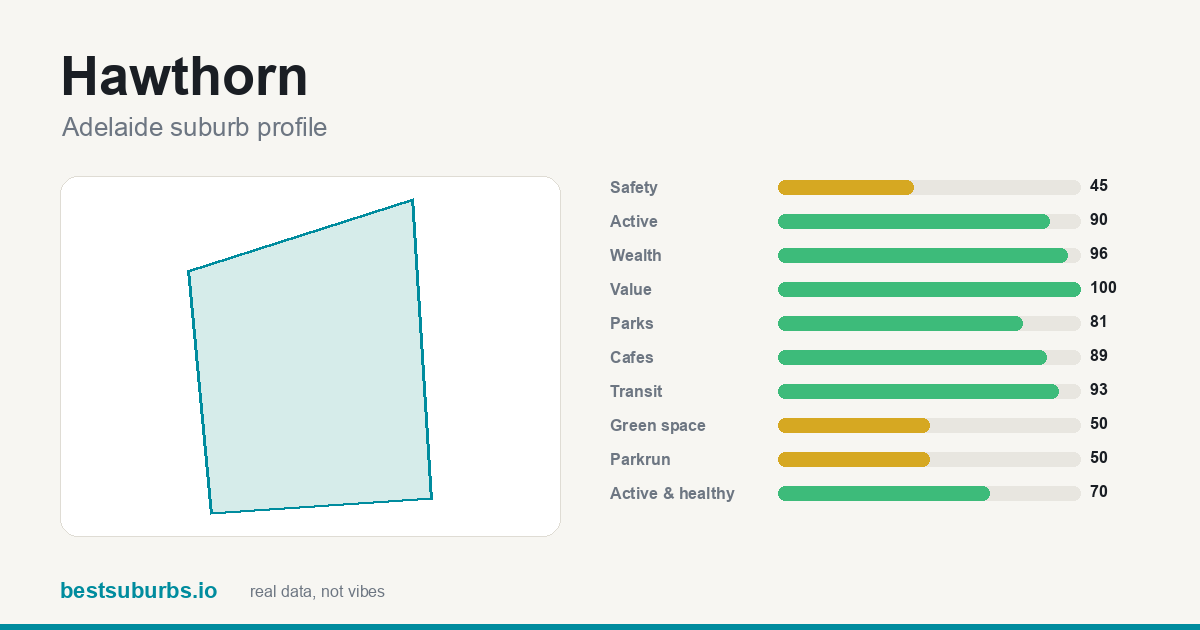 Hawthorn Hawthorn | — | 16.2 | 70 | $1,810,500 |
| 12 | 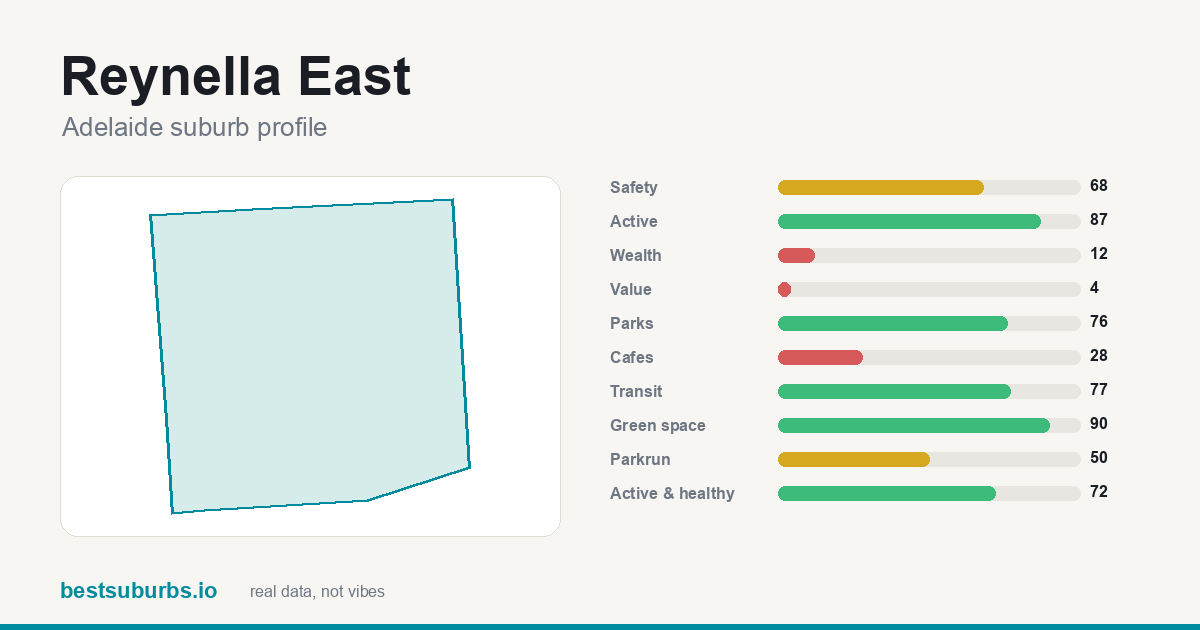 Reynella East Reynella East | — | 22.1 | 72 | $805,000 |
| 13 | 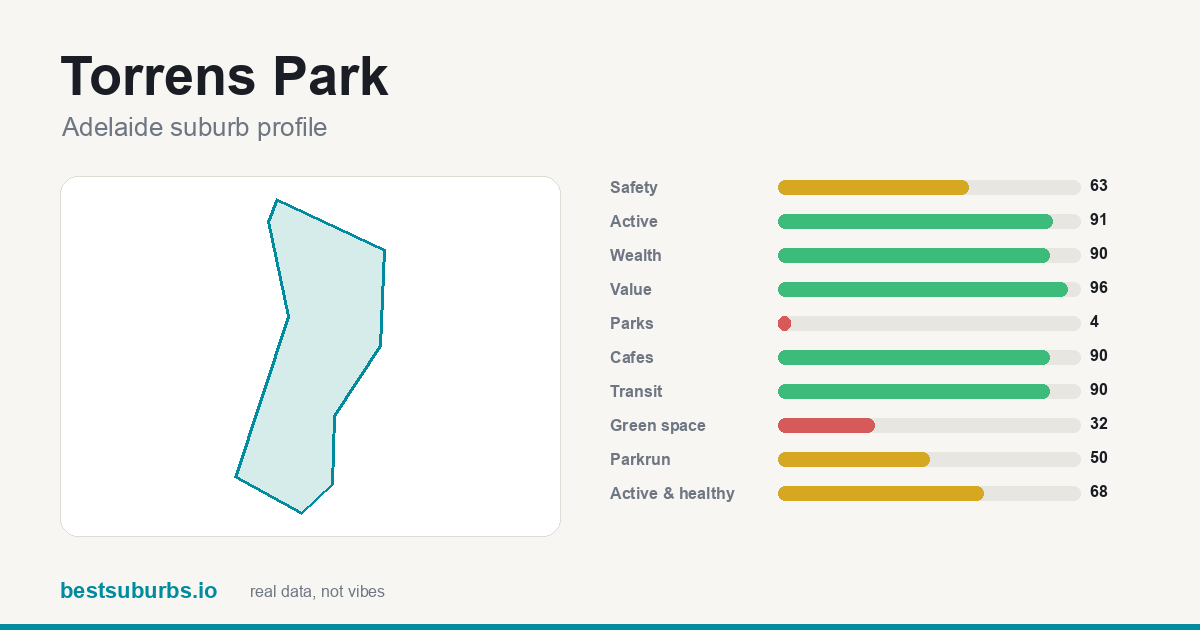 Torrens Park Torrens Park | — | 20.1 | 68 | $2,460,000 |
| 14 | 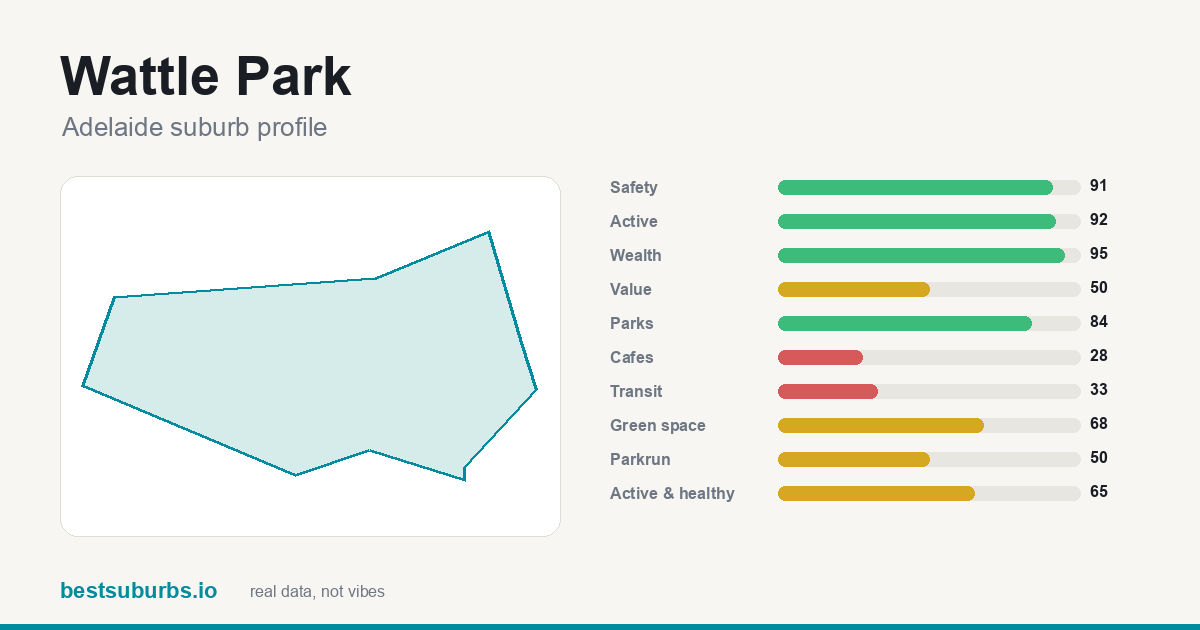 Wattle Park Wattle Park | — | 17.5 | 65 | $1,970,000 |
| 15 | 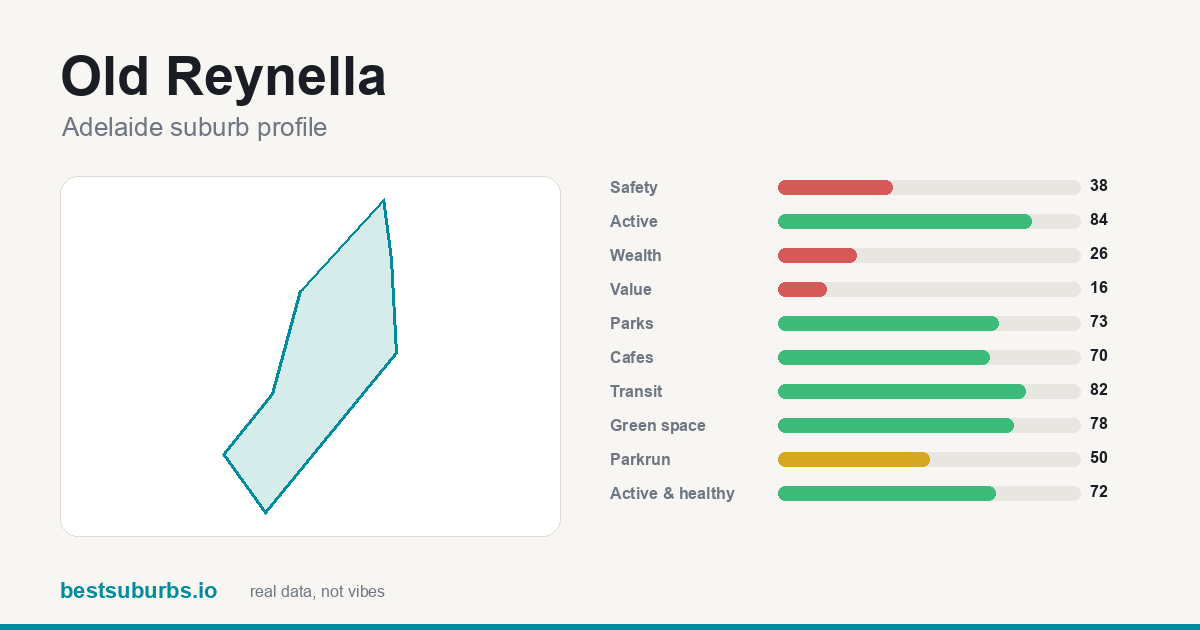 Old Reynella Old Reynella | — | 9.8 | 72 | $930,000 |
| 16 | 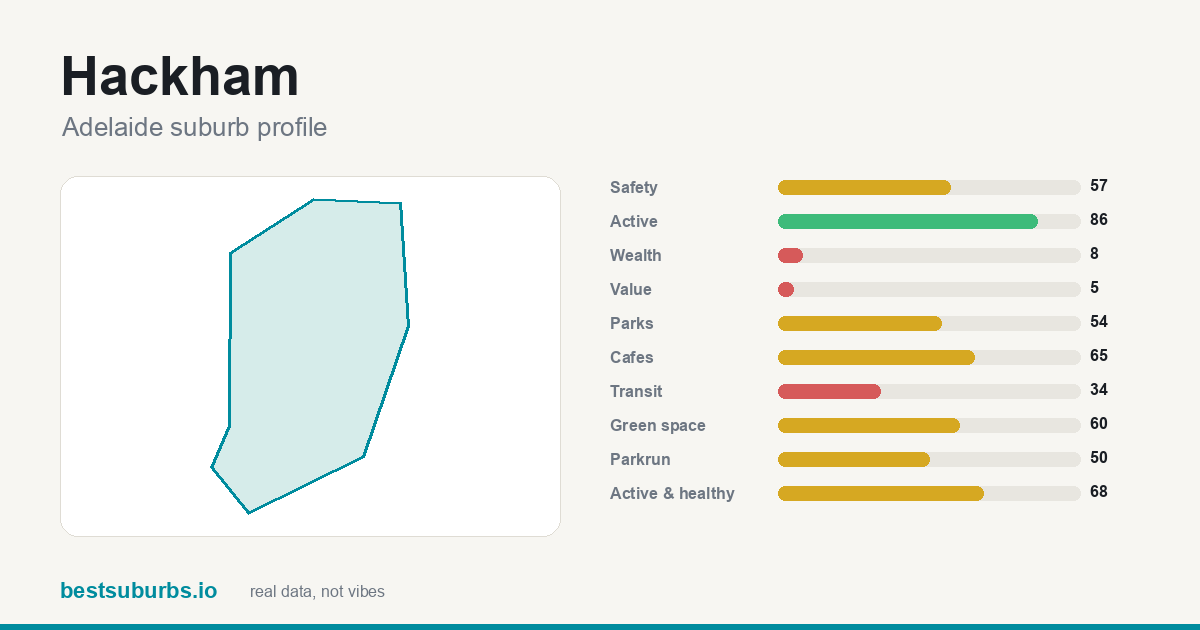 Hackham Hackham | — | 14.0 | 68 | $800,000 |
| 17 | 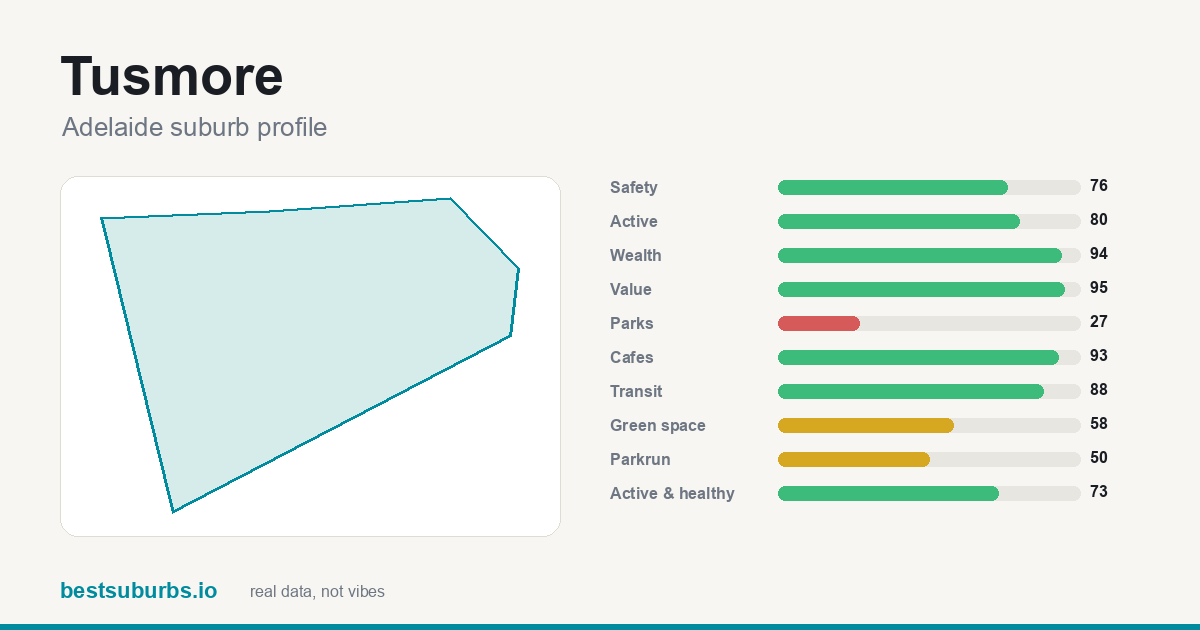 Tusmore Tusmore | — | 16.6 | 73 | $2,925,000 |
| 18 | 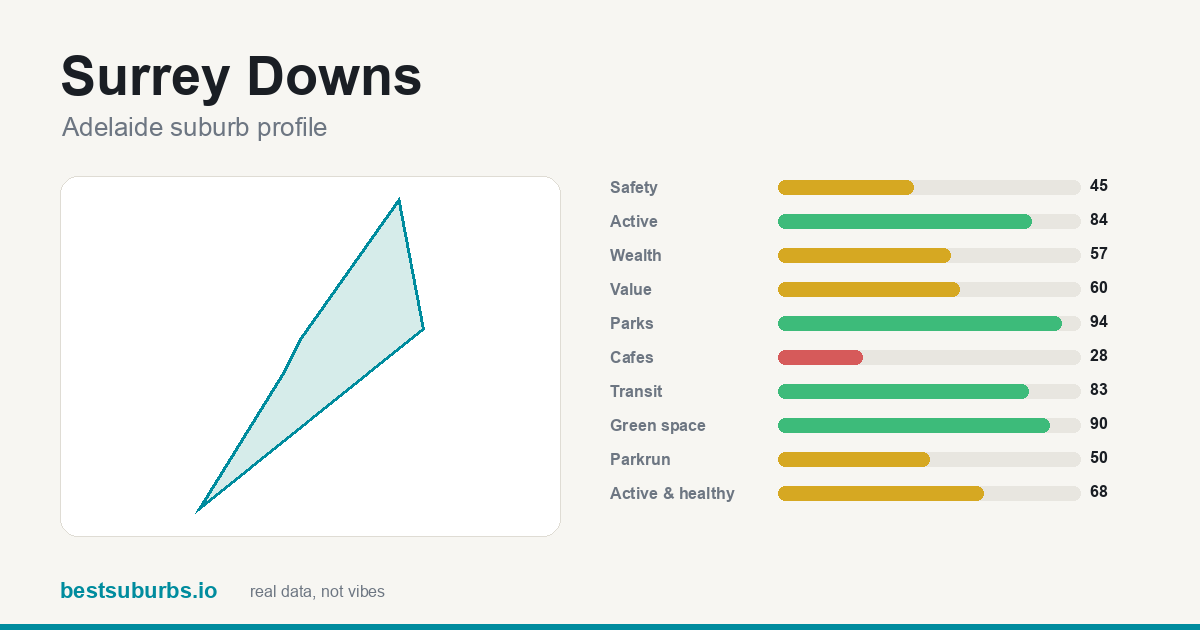 Surrey Downs Surrey Downs | — | 10.7 | 68 | $850,000 |
| 19 | 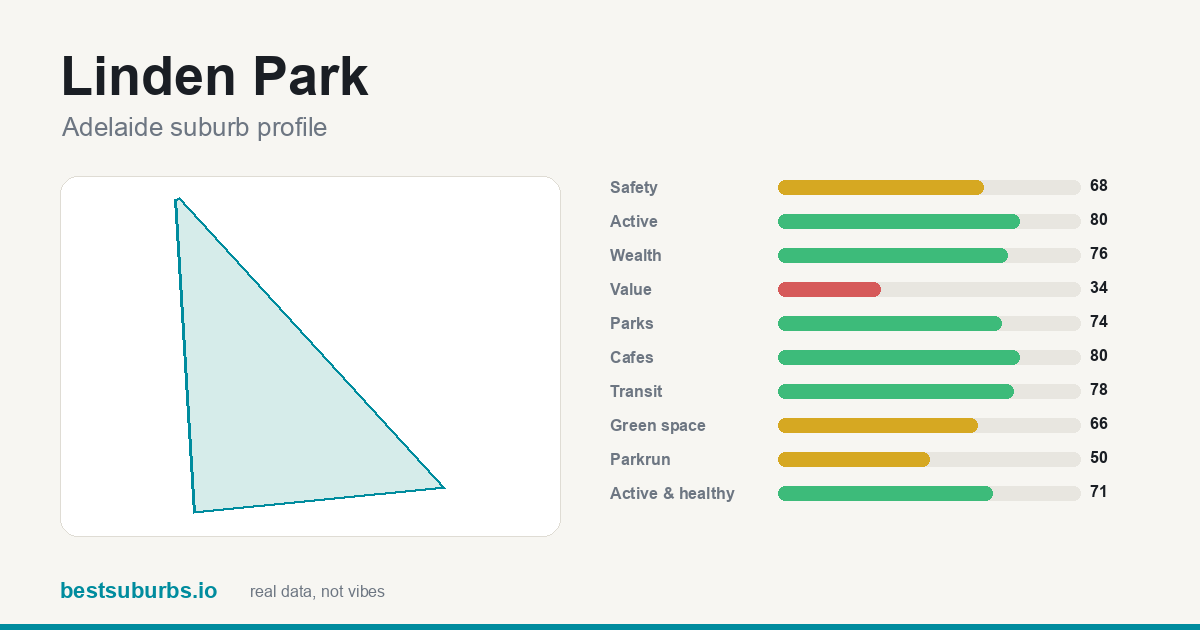 Linden Park Linden Park | — | 11.0 | 71 | $1,950,000 |
| 20 | 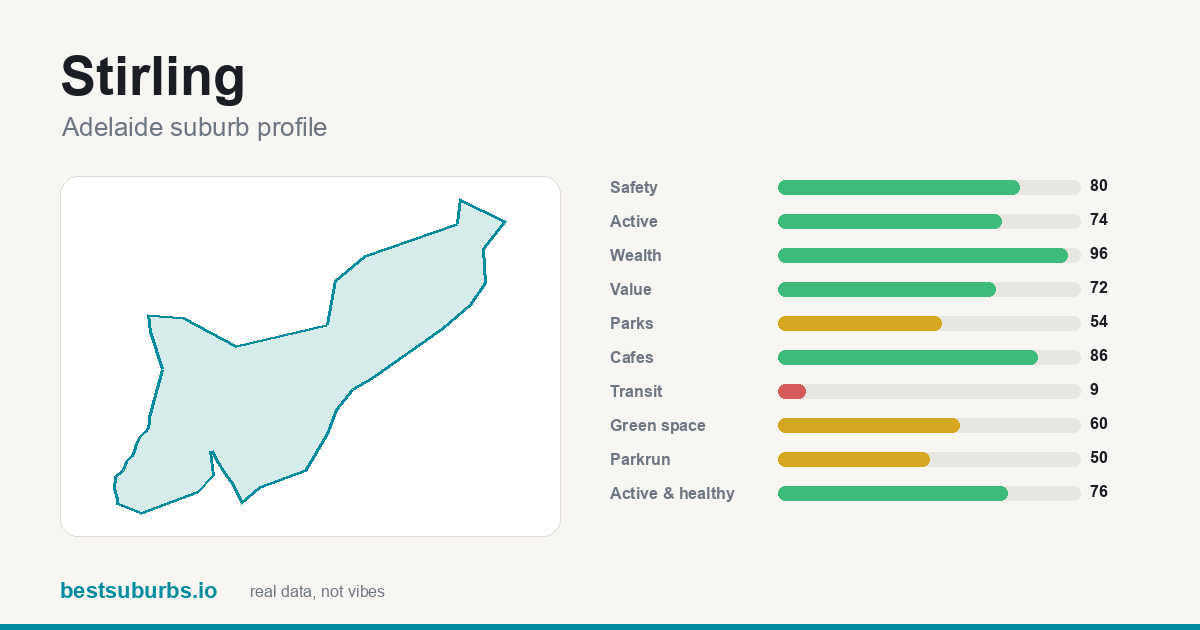 Stirling Stirling | — | 23.8 | 76 | $1,645,000 |
| 21 | 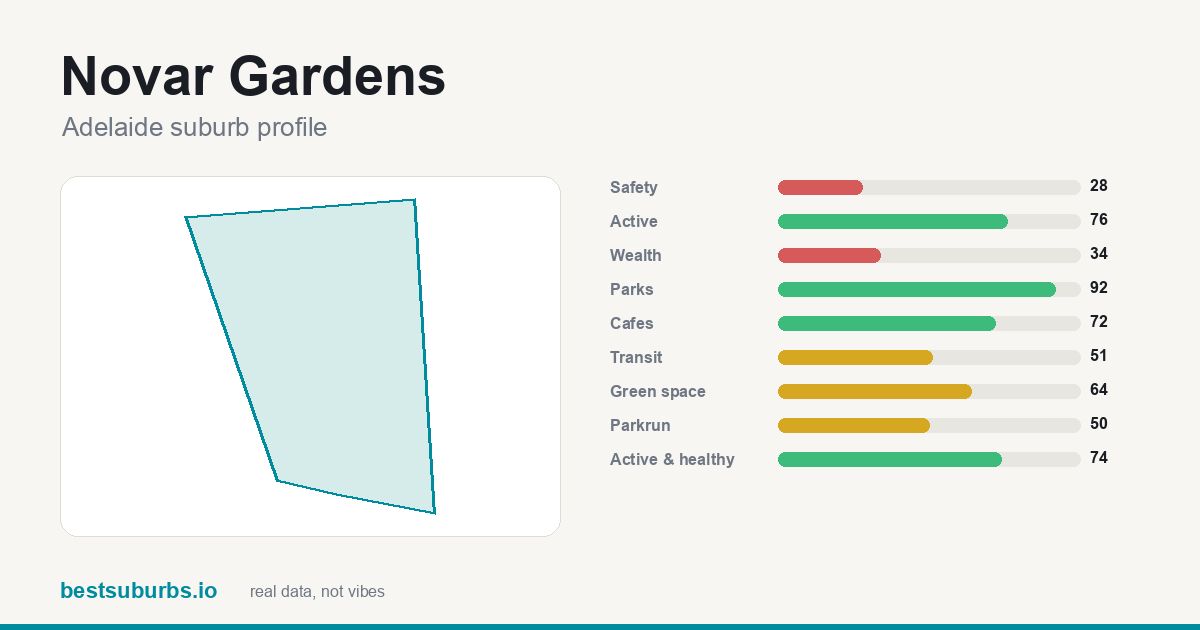 Novar Gardens Novar Gardens | — | 20.7 | 74 | $1,485,000 |
| 22 | 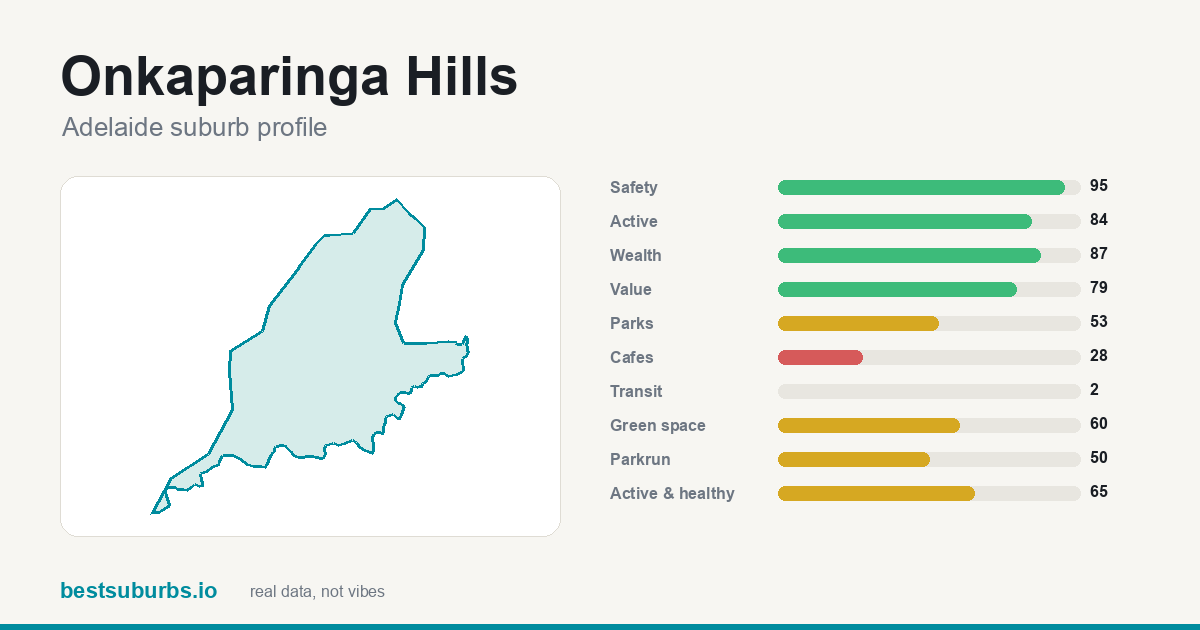 Onkaparinga Hills Onkaparinga Hills | — | 25.3 | 65 | $988,000 |
| 23 | 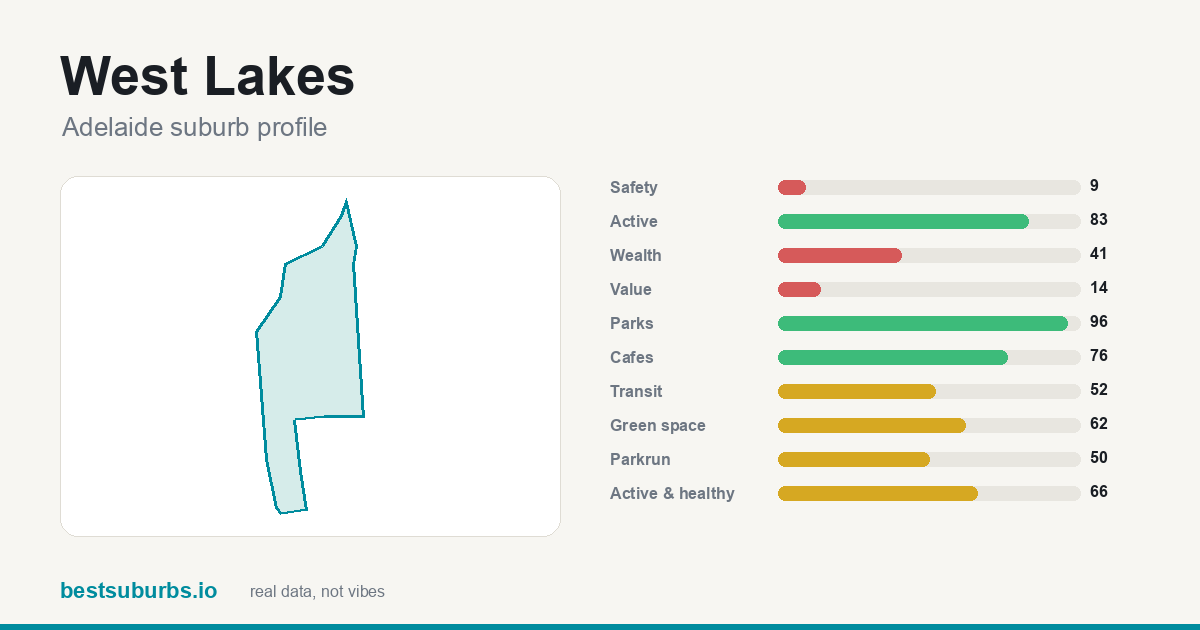 West Lakes West Lakes | — | 6.9 | 66 | $1,410,000 |
| 24 | 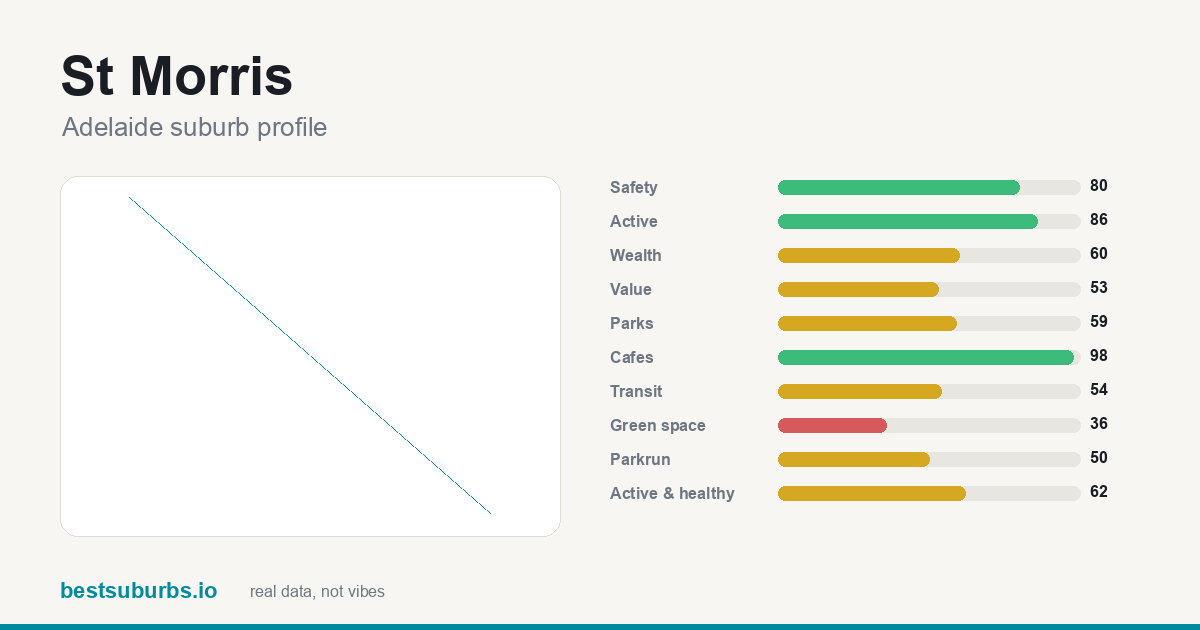 St Morris St Morris | — | 6.3 | 62 | $1,334,500 |
| 25 | 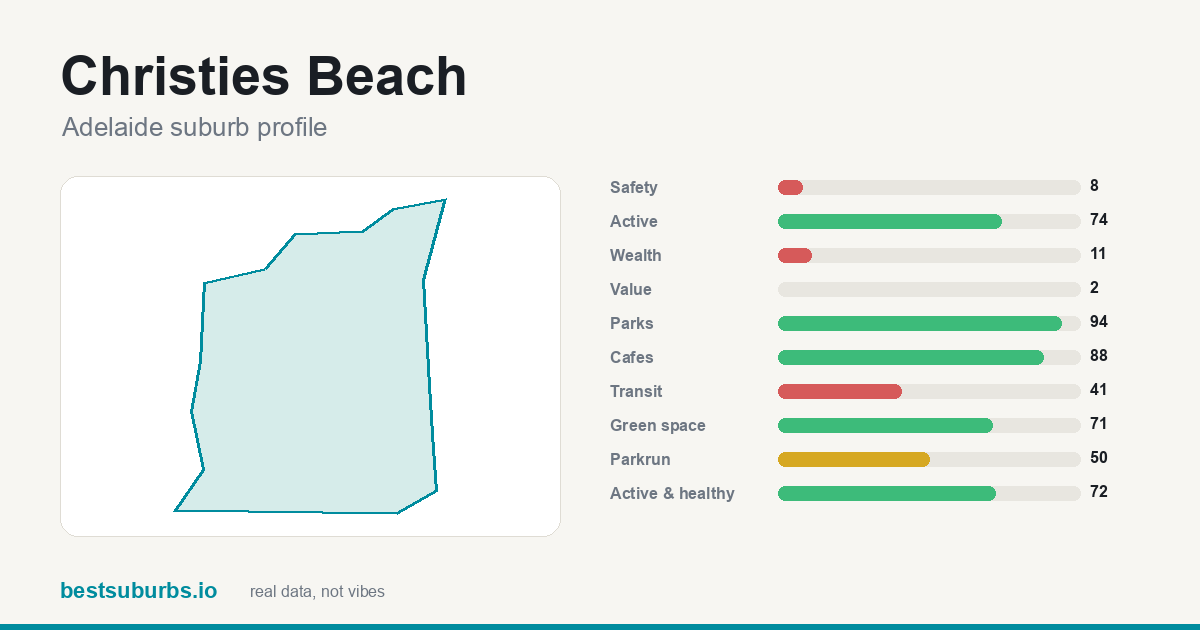 Christies Beach Christies Beach | — | 9.4 | 72 | $1,055,000 |
Showing the top 25 of 274 ranked suburbs. Scores are percentiles against every other suburb in Adelaide: 100 is the best in the city, 50 is mid-table. Click any suburb for its full profile.
Why are these the 10 most active suburbs in Adelaide? (October 2026)
Updated 17 October 2026 · one sentence of real reasons per suburb, from the data on this page.
- O'Halloran Hill ★ 88
O'Halloran Hill takes #1 on 100% of it within 400 m of a park, with 142.5 ha of parkland per 1,000 residents, and 1 government primary school inside the suburb.
- North Adelaide ★ 88
What lifts North Adelaide to #2 is 99% of it within 400 m of a park; it also has 29.6 ha of parkland per 1,000 residents, and 18 cafés.
- Adelaide ★ 86
Adelaide ranks #3: 98% of it within 400 m of a park, 7 government primary schools and 7 secondary inside the suburb, and 157 cafés.
- Belair ★ 84
Belair takes #4 on a recorded crime rate of about 18 offences per 1,000 residents (safety score 87/100), with 86% of it within 400 m of a park, and 3 government primary schools inside the suburb.
- Alberton ★ 84
What lifts Alberton to #5 is 100% of it within 400 m of a park; it also has 2.1 ha of parkland per 1,000 residents, and 1 cafés.
- Kensington Gardens ★ 81
What lifts Kensington Gardens to #6 is a recorded crime rate of about 24 offences per 1,000 residents (safety score 81/100); it also has 26 public transport stops inside it for a transit score of 78, and 69% of it within 400 m of a park.
- Leabrook ★ 81
#7 Leabrook — a recorded crime rate of about 19 offences per 1,000 residents (safety score 86/100), plus 89% of it within 400 m of a park, and 19 public transport stops inside it for a transit score of 92.
- Port Noarlunga ★ 80
Port Noarlunga takes #8 on 93% of it within 400 m of a park, with 1 government primary school inside the suburb, and 3 cafés.
- Millswood ★ 80
Millswood ranks #9: 98% of it within 400 m of a park, a recorded crime rate of about 30 offences per 1,000 residents (safety score 73/100), and 2.8 ha of parkland per 1,000 residents.
- Hallett Cove ★ 80
Hallett Cove (#10) scores on a recorded crime rate of about 20 offences per 1,000 residents (safety score 85/100) and 81% of it within 400 m of a park, and 3 government primary schools inside the suburb.
Why each of the top 10 healthiest, most active suburbs in Adelaide ranks where it does
Written from this page's own data: each figure below is the suburb's own value, set against the Adelaide median where we hold one.
1. O'Halloran Hill
O'Halloran Hill is #1 of 274 ranked Adelaide suburbs on this list, with a score of 88/100. It has an activity score of 95, a healthy score of 82 and 29.4 gyms and sports facilities per 1,000 residents. The trade-off: it scores 5/100 for public transport, so it is weaker there. It covers 7 km² with about 2,722 residents (census).
2. North Adelaide
North Adelaide is #2 of 274 ranked Adelaide suburbs on this list, with a score of 88/100. It has an activity score of 90, a healthy score of 85 and 28.9 gyms and sports facilities per 1,000 residents. The trade-off: it scores 19/100 for safety, so it is weaker there. It covers 4.8 km² with about 6,823 residents (census).
3. Adelaide
Adelaide is #3 of 274 ranked Adelaide suburbs on this list, with a score of 86/100. It has an activity score of 92, a healthy score of 80 and 11.1 gyms and sports facilities per 1,000 residents. The trade-off: it scores 0/100 for safety, so it is weaker there. It covers 10.4 km² with about 18,202 residents (census).
4. Belair
Belair is #4 of 274 ranked Adelaide suburbs on this list, with a score of 84/100. It has an activity score of 92, a healthy score of 75 and 14.4 gyms and sports facilities per 1,000 residents. The trade-off: it scores 6/100 for public transport, so it is weaker there. It covers 14.9 km² with about 4,718 residents (census).
5. Alberton
Alberton is #5 of 274 ranked Adelaide suburbs on this list, with a score of 84/100. It has an activity score of 90, a healthy score of 77 and 17.7 gyms and sports facilities per 1,000 residents. The trade-off: it scores 10/100 for safety, so it is weaker there. It covers 0.9 km² with about 1,860 residents (census).
6. Kensington Gardens
Kensington Gardens is #6 of 274 ranked Adelaide suburbs on this list, with a score of 81/100. It has an activity score of 92, a healthy score of 70 and 18.8 gyms and sports facilities per 1,000 residents. The trade-off: it scores 14/100 for parks, so it is weaker there. It covers 1.1 km² with about 2,498 residents (census).
7. Leabrook
Leabrook is #7 of 274 ranked Adelaide suburbs on this list, with a score of 81/100. It has an activity score of 90, a healthy score of 72 and 21.2 gyms and sports facilities per 1,000 residents. It covers 0.6 km² with about 1,605 residents (census).
8. Port Noarlunga
Port Noarlunga is #8 of 274 ranked Adelaide suburbs on this list, with a score of 80/100. It has an activity score of 84, a healthy score of 77 and 19.1 gyms and sports facilities per 1,000 residents. The trade-off: it scores 11/100 for public transport, so it is weaker there. It covers 2.6 km² with about 3,245 residents (census).
9. Millswood
Millswood is #9 of 274 ranked Adelaide suburbs on this list, with a score of 80/100. It has an activity score of 93, a healthy score of 68 and 19.3 gyms and sports facilities per 1,000 residents. The trade-off: it scores 28/100 for cafés, so it is weaker there. It covers 0.9 km² with about 2,173 residents (census).
10. Hallett Cove
Hallett Cove is #10 of 274 ranked Adelaide suburbs on this list, with a score of 80/100. It has an activity score of 88, a healthy score of 72 and 24.6 gyms and sports facilities per 1,000 residents. The trade-off: it scores 21/100 for public transport, so it is weaker there. It covers 9.9 km² with about 12,512 residents (census).
How do these suburbs compare head to head?
What else do people ask about healthiest, most active suburbs in Adelaide?
What are the healthiest, most active suburbs in Adelaide?
On our October 2026 data the top five are O'Halloran Hill (88/100), North Adelaide (88/100), Adelaide (86/100), Belair (84/100), Alberton (84/100), out of 274 ranked Adelaide suburbs.
How is this ranking calculated?
GPS activity heat per square kilometre from open activity traces, blended with the healthy score (gyms, sports facilities and parks per resident). This is the dataset nobody else in the category publishes. 274 of 274 Adelaide suburbs had enough data to be ranked. Updated October 2026.
Is this ranking sponsored?
No. No ranking on this site is sold or sponsored. It is computed from open data: GPS activity traces, official crime statistics, the ABS census and OpenStreetMap.
What other Adelaide rankings are there?
Sources: open GPS activity traces, official crime statistics, ABS census,
OpenStreetMap (ODbL). Sale prices: SA Government Metropolitan Median House Sales, April–June 2026 quarter (2Q 2026) — © Government of South Australia (Land Services SA), Metropolitan Median House Sales, CC BY 4.0. Quarterly median house sale price per suburb, metropolitan Adelaide. Units are not in this dataset. Figures marked as low-volume rest on fewer than 10 sales that quarter. No ranking on this site is sold or sponsored.
← all 274 Adelaide suburbs, with sliders