How this works
The viral "Strava heatmap = good suburb" trick has a real insight buried in it — places where people run, ride and walk at night are usually places people feel safe. But heat lines alone mostly show where fit people live, and they happily run straight through high-crime pockets. So we treat activity as one signal of five, and back it with official data.
🏃 Activity
Density of public GPS traces (OpenStreetMap, ODbL) plus gyms, ovals, pools and sports facilities per km². The glowing map layer is this data, rendered raw.
🛡️ Safety
Offences per 1,000 residents from South Australia Police, full financial year, per suburb. Note: SAPOL withhold sexual offences at suburb level for privacy, so this counts offences against the person and against property — it is not directly comparable with the Melbourne or Sydney totals.
💰 Value
Median household income vs median rent (ABS Census 2021). High score = your rent buys more suburb than it should.
🏷️ Sale prices
Sale prices: SA Government Metropolitan Median House Sales, April–June 2026 quarter (2Q 2026) — © Government of South Australia (Land Services SA), Metropolitan Median House Sales, CC BY 4.0. Quarterly median house sale price per suburb, metropolitan Adelaide. Units are not in this dataset. Figures marked as low-volume rest on fewer than 10 sales that quarter.
🌳 Parks & ☕ Cafés
OpenStreetMap park and café density per km², blended 50/50 with the same counts normalised per 1,000 residents so both crowded inner suburbs and sparser leafy ones can score well.
💪 Active & Healthy
A composite of fitness-infrastructure density (gyms/ovals/pools per capita), proximity + attendance at the nearest parkrun event, % of the suburb within 400m of a park, and café density per capita. Off by default — drag its slider up to weight it into the ranking.
🧮 The blend
Every suburb gets a 0–100 percentile per signal. Your sliders weight the signals; the headline number is the weighted blend. No paid placements, ever.
Top 10 suburbs in Adelaide (October 2026)
Updated 17 October 2026 · one sentence of real reasons per suburb, from the data on this page.
- Leabrook ★ 86
#1 Leabrook — a recorded crime rate of about 19 offences per 1,000 residents (safety score 86/100), plus 89% of it within 400 m of a park, and 19 public transport stops inside it for a transit score of 92.
- Hazelwood Park ★ 83
Hazelwood Park takes #2 on a recorded crime rate of about 16 offences per 1,000 residents (safety score 92/100), with 97% of it within 400 m of a park, and 20 public transport stops inside it for a transit score of 76.
- Colonel Light Gardens ★ 82
What lifts Colonel Light Gardens to #3 is a recorded crime rate of about 17 offences per 1,000 residents (safety score 89/100); it also has 38 public transport stops inside it for a transit score of 85, and 2 government primary schools inside the suburb.
- Belair ★ 80
Belair takes #4 on a recorded crime rate of about 18 offences per 1,000 residents (safety score 87/100), with 86% of it within 400 m of a park, and 3 government primary schools inside the suburb.
- Hawthorn ★ 78
Hawthorn (#5) scores on 33 public transport stops inside it for a transit score of 95 and 83% of it within 400 m of a park, and 2 cafés.
- Dulwich ★ 77
What lifts Dulwich to #6 is a recorded crime rate of about 25 offences per 1,000 residents (safety score 79/100); it also has 2 cafés, and 70% of it within 400 m of a park.
- St Morris ★ 76
St Morris ranks #7: a recorded crime rate of about 24 offences per 1,000 residents (safety score 80/100), 4 cafés, and 72% of it within 400 m of a park.
- Burnside ★ 76
Burnside (#8) scores on a recorded crime rate of about 12 offences per 1,000 residents (safety score 95/100) and 87% of it within 400 m of a park, and 1 government primary school inside the suburb.
- Tusmore ★ 76
Tusmore (#9) scores on a recorded crime rate of about 27 offences per 1,000 residents (safety score 76/100) and 86% of it within 400 m of a park, and 19 public transport stops inside it for a transit score of 88.
- Millswood ★ 75
What lifts Millswood to #10 is 98% of it within 400 m of a park; it also has a recorded crime rate of about 30 offences per 1,000 residents (safety score 73/100), and 2.8 ha of parkland per 1,000 residents.
What are the best suburbs in Adelaide for families?
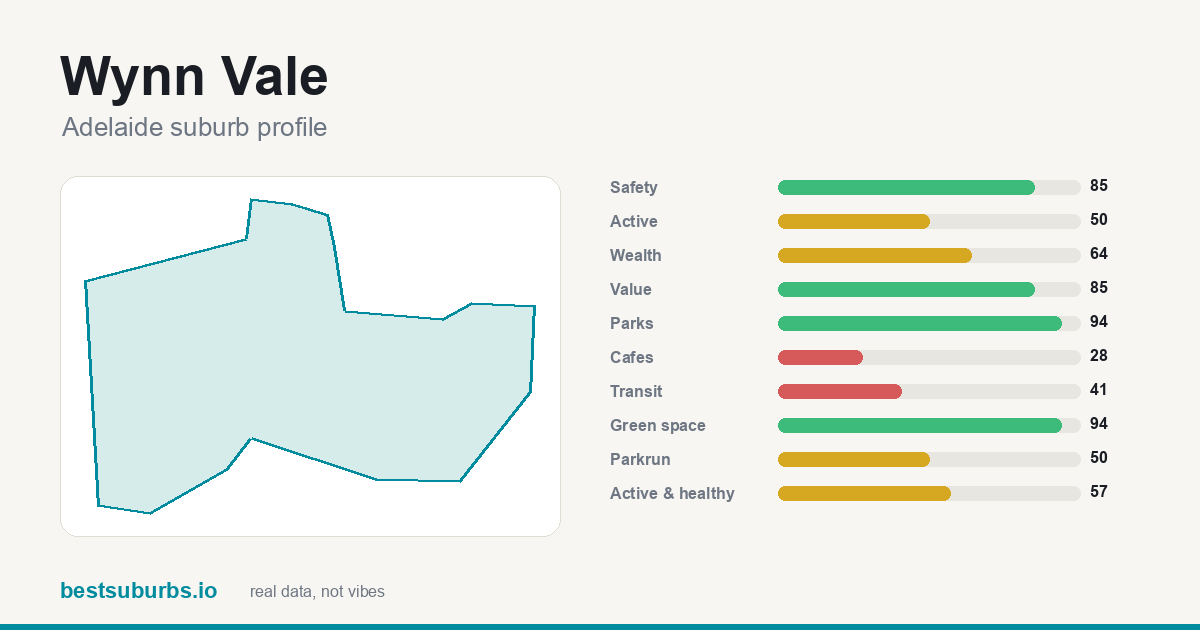 Wynn Vale — safety 85/100, parks 94/100, green space 94/100
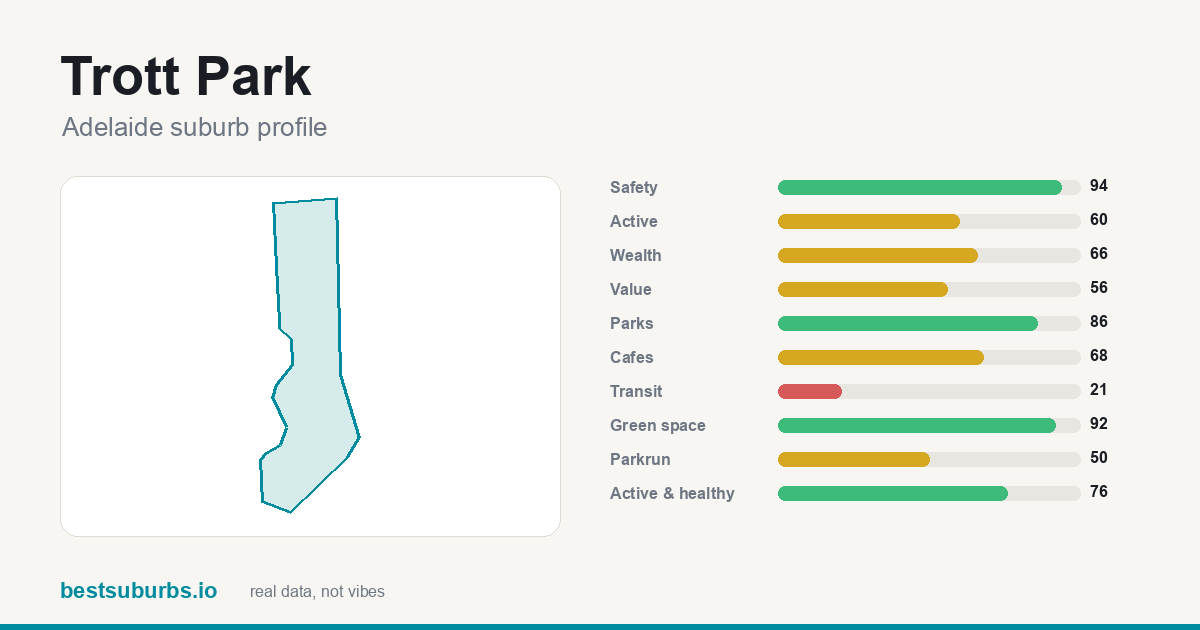 Trott Park — safety 94/100, parks 86/100, green space 92/100
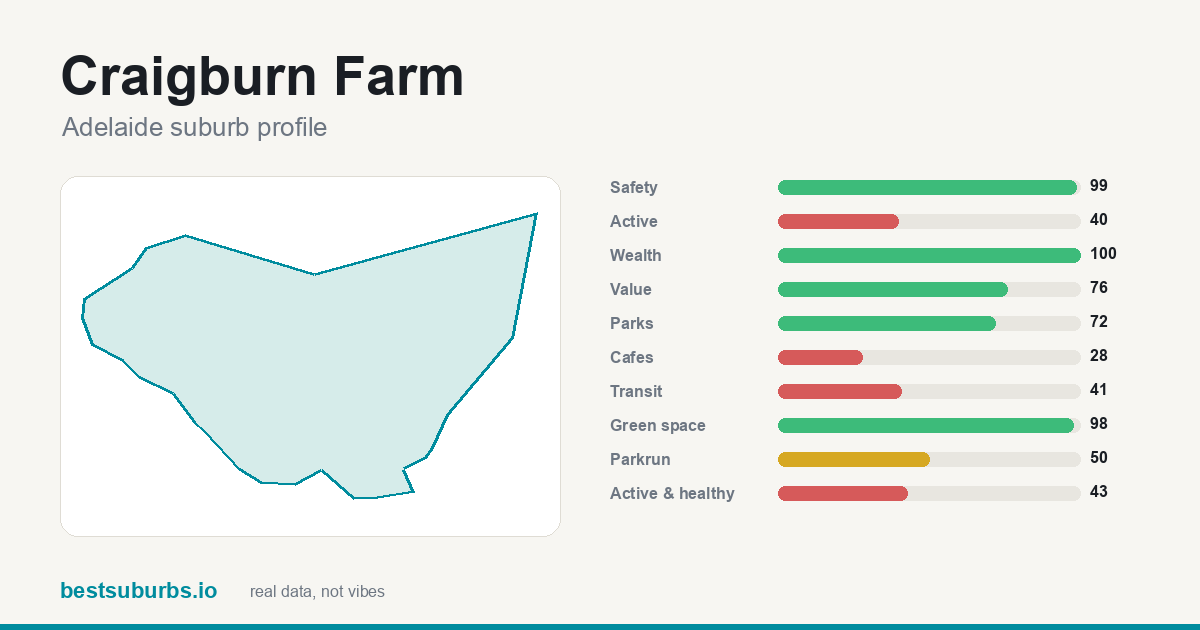 Craigburn Farm — safety 99/100, parks 72/100, green space 98/100
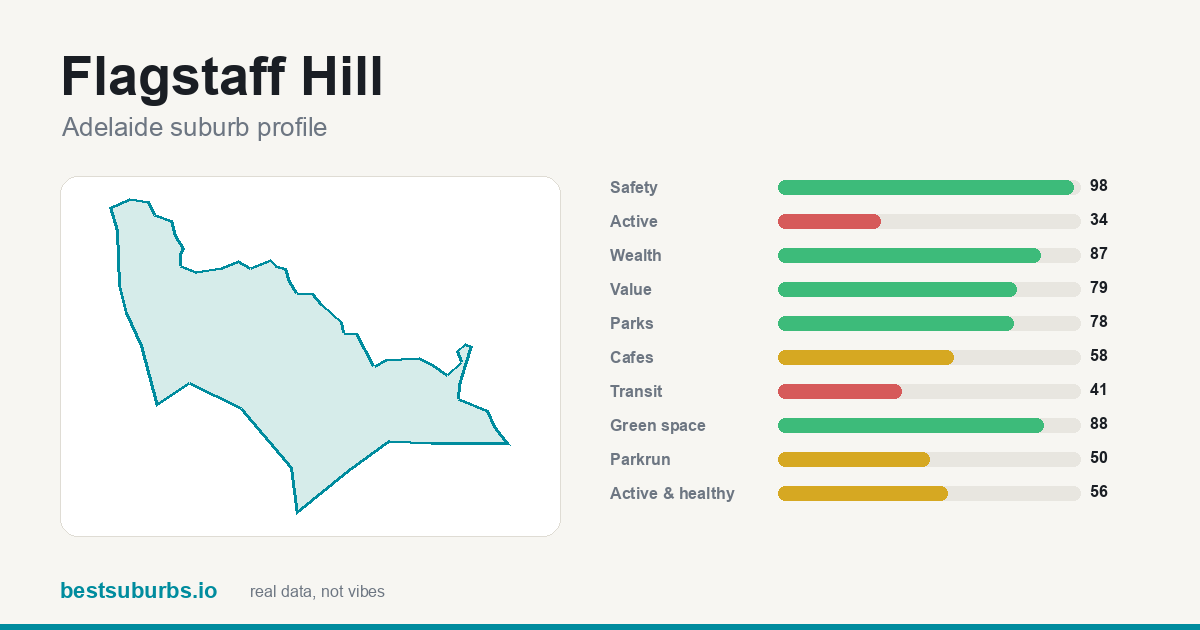 Flagstaff Hill — safety 98/100, parks 78/100, green space 88/100
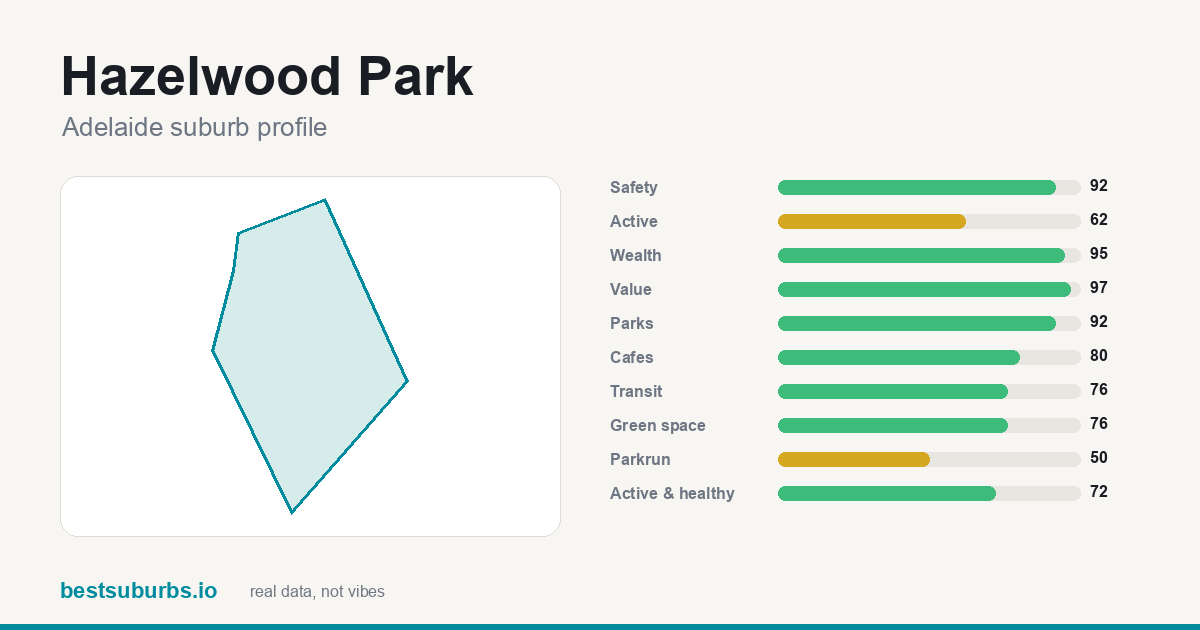 Hazelwood Park — safety 92/100, parks 92/100, green space 76/100
See the full what are the best suburbs in Adelaide for families? ranking →
What are the safest suburbs in Adelaide?
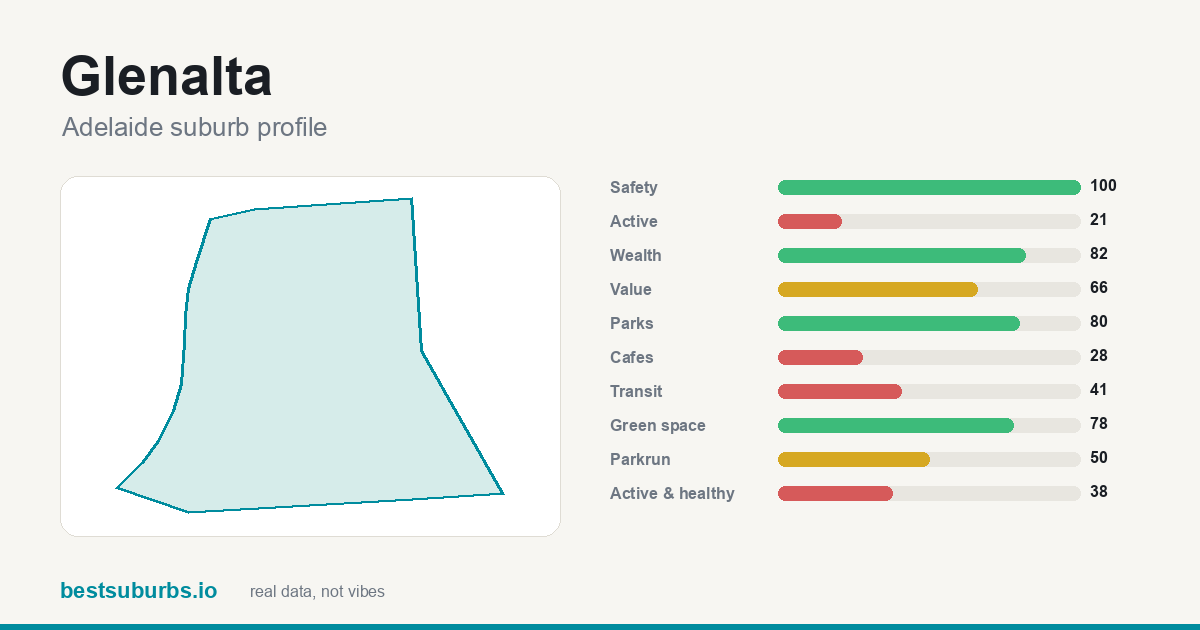 Glenalta — safety score 100/100, 4 recorded offences per 1,000 residents
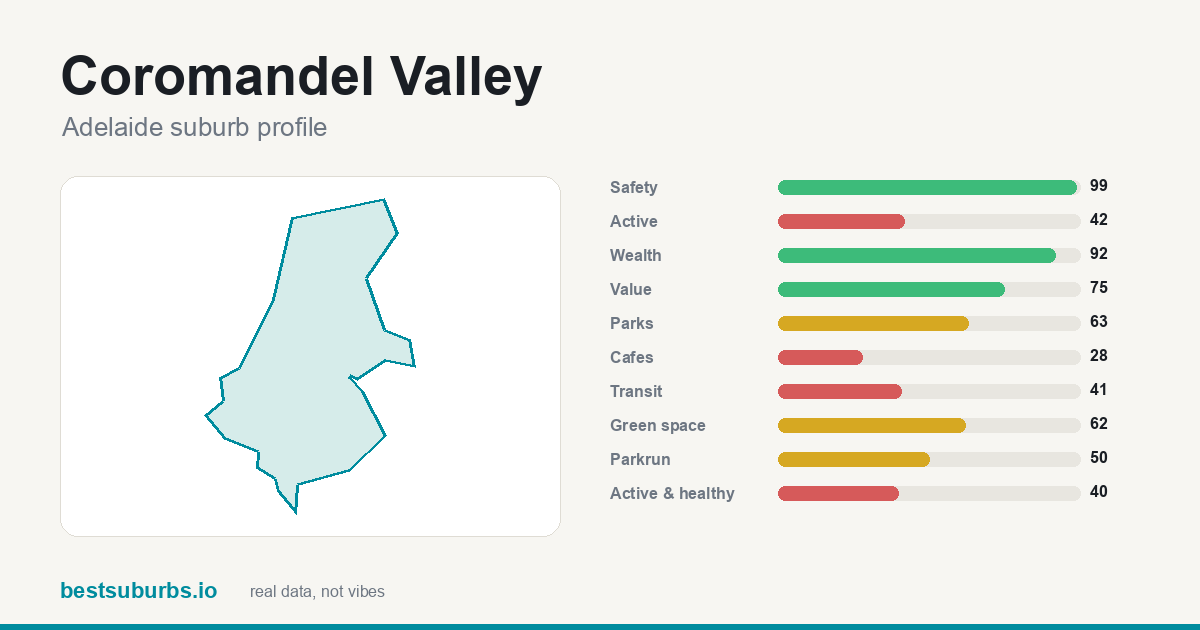 Coromandel Valley — safety score 99/100, 6 recorded offences per 1,000 residents
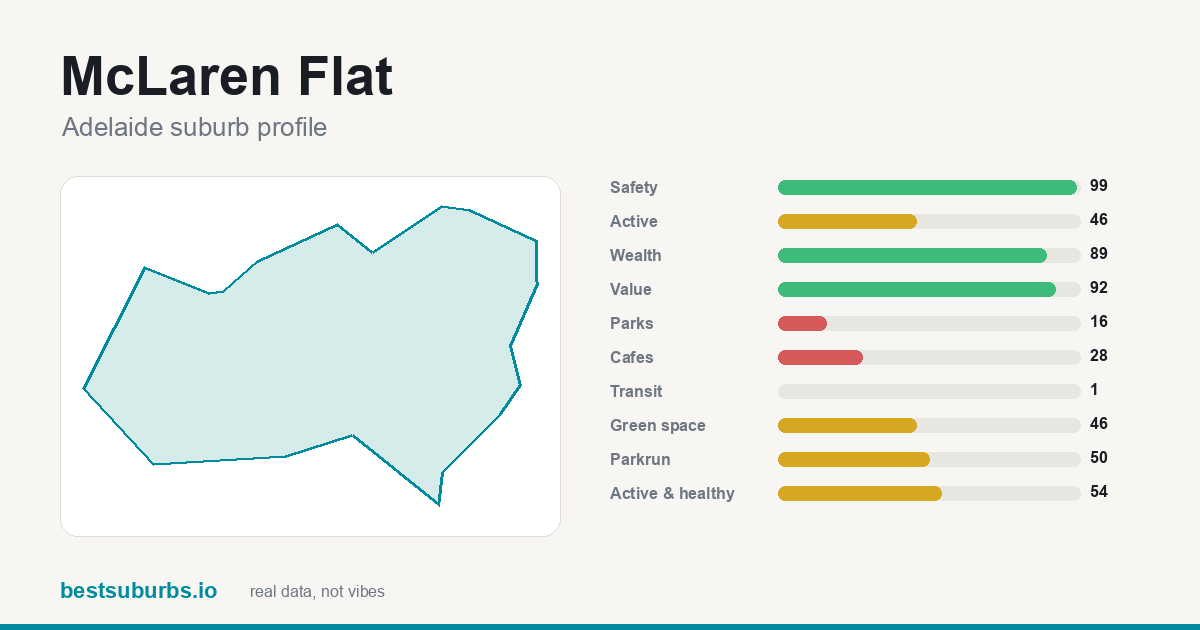 McLaren Flat — safety score 99/100, 6 recorded offences per 1,000 residents
- Craigburn Farm — safety score 99/100, 5 recorded offences per 1,000 residents
- Flagstaff Hill — safety score 98/100, 10 recorded offences per 1,000 residents
See the full what are the safest suburbs in Adelaide? ranking →
Which Adelaide suburbs offer the best value?
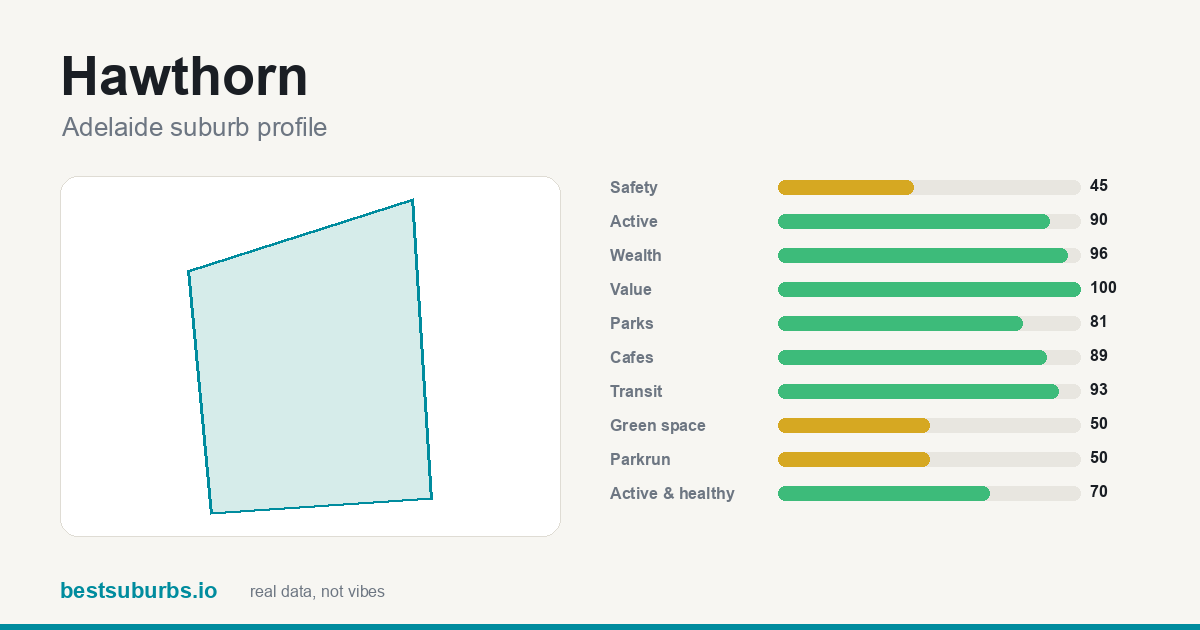 Hawthorn — value score 100/100, median rent $295/wk
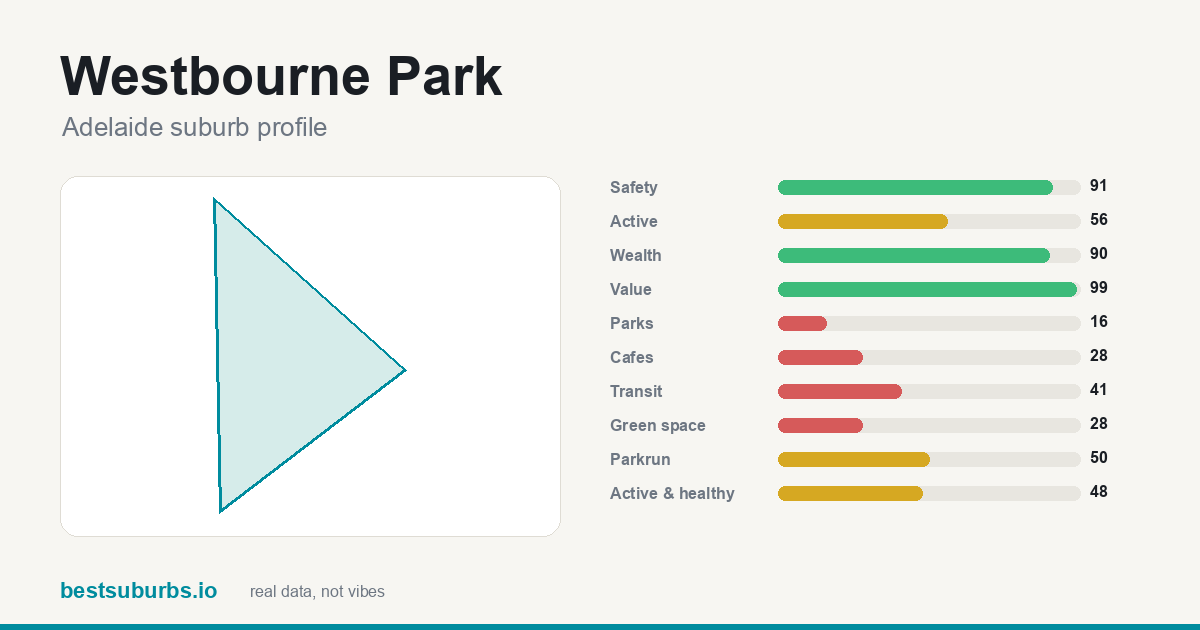 Westbourne Park — value score 99/100, median rent $305/wk
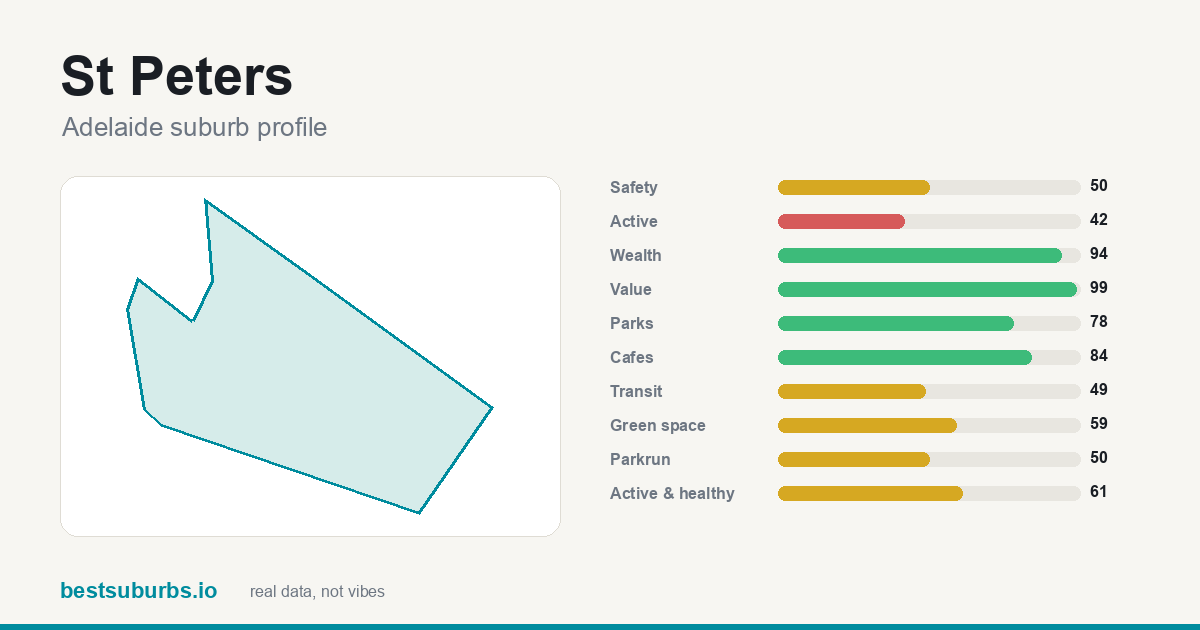 St Peters — value score 99/100, median rent $310/wk
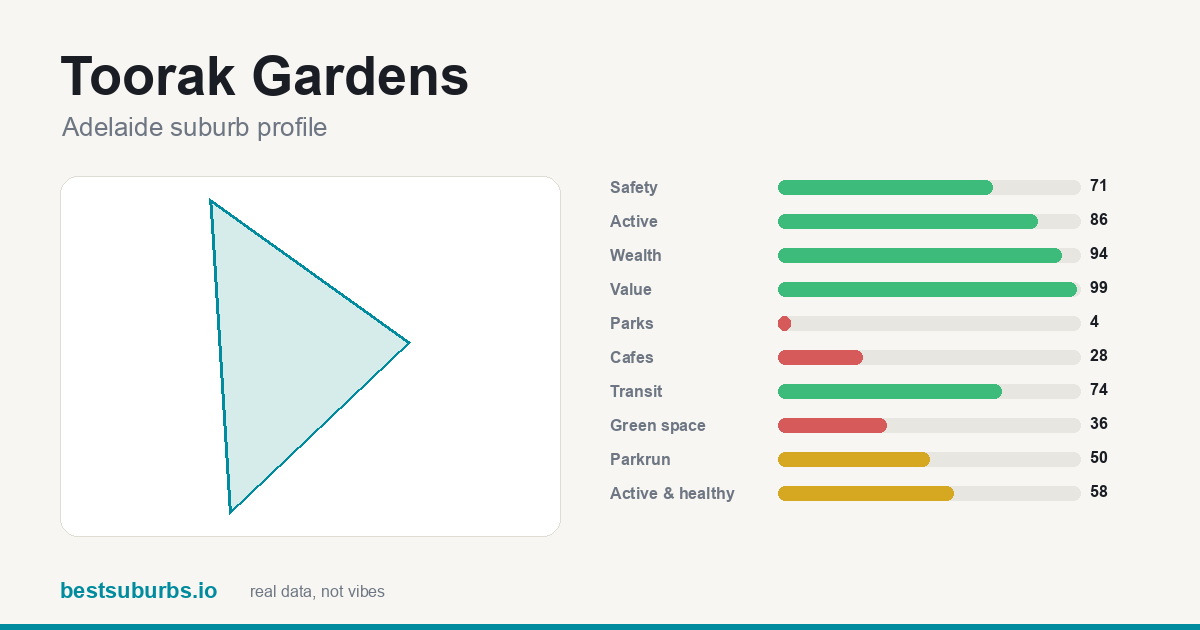 Toorak Gardens — value score 99/100, median rent $320/wk
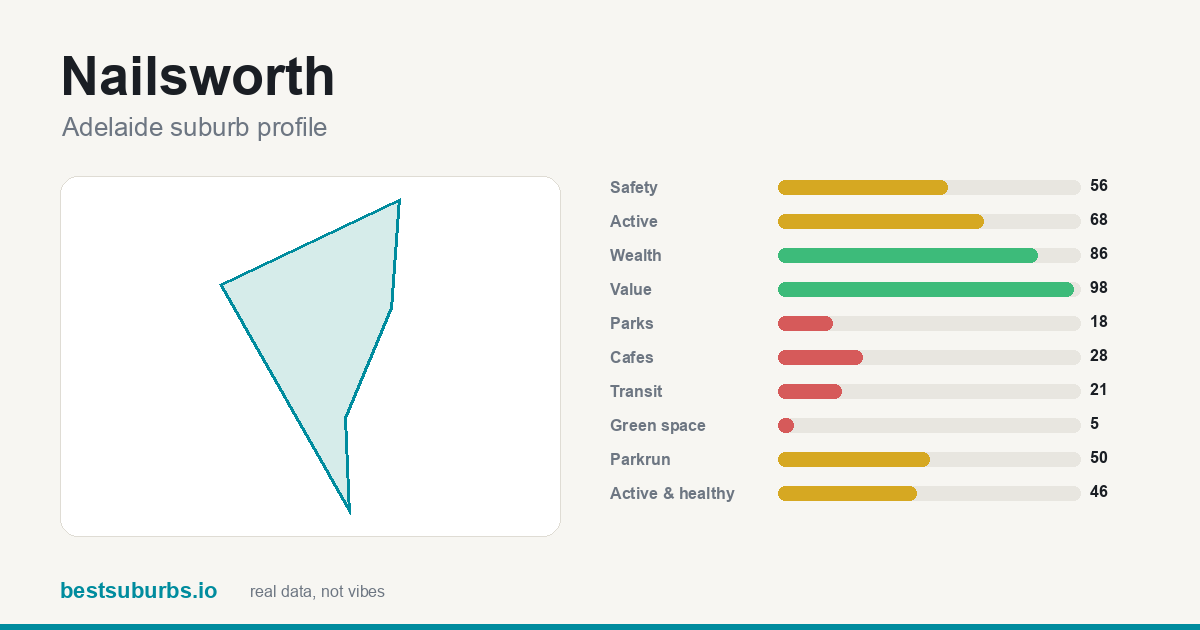 Nailsworth — value score 98/100, median rent $300/wk
See the full which Adelaide suburbs offer the best value? ranking →
What are the best inner-city & lifestyle suburbs in Adelaide?
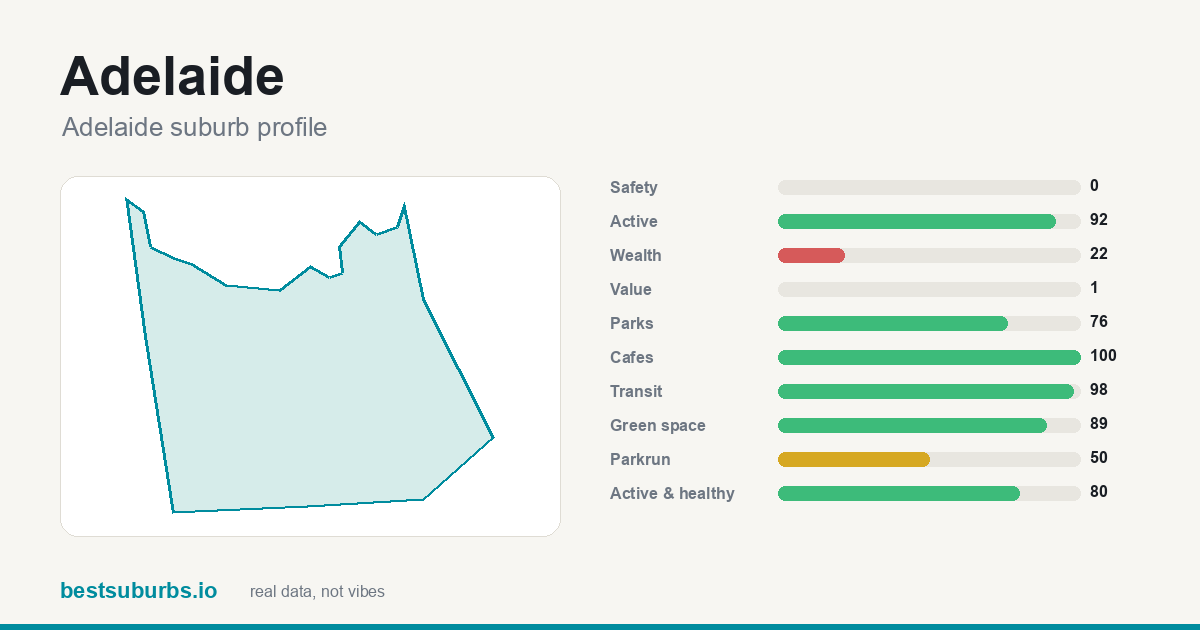 Adelaide — cafés 100/100, transit 87/100, activity 92/100
- Hawthorn — cafés 89/100, transit 95/100, activity 90/100
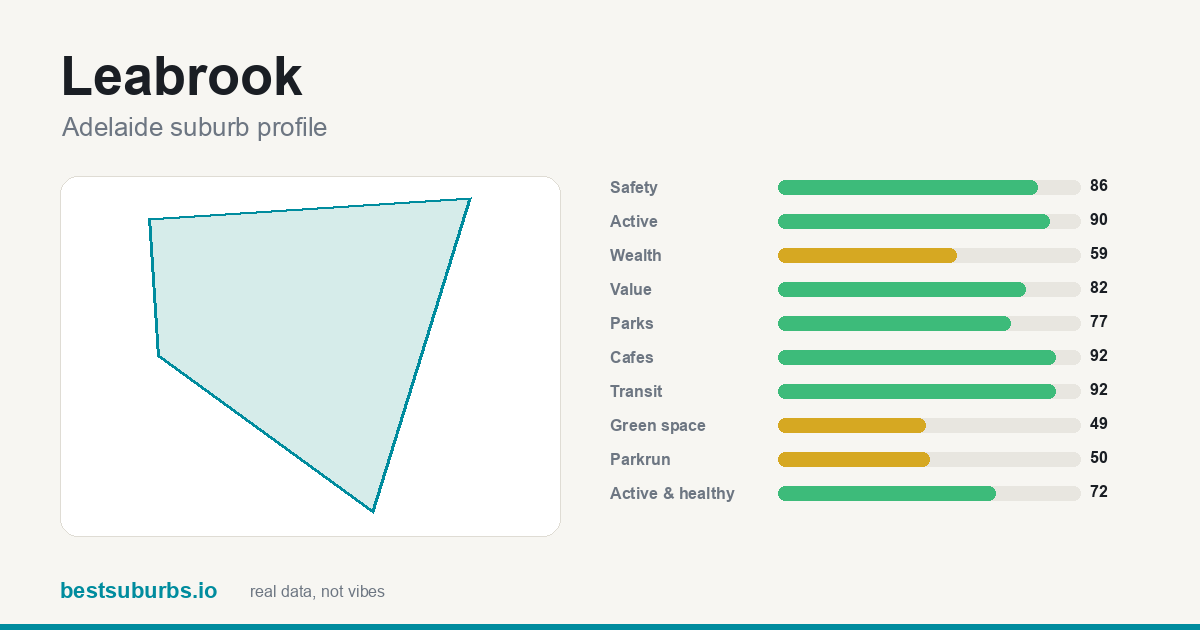 Leabrook — cafés 92/100, transit 92/100, activity 90/100
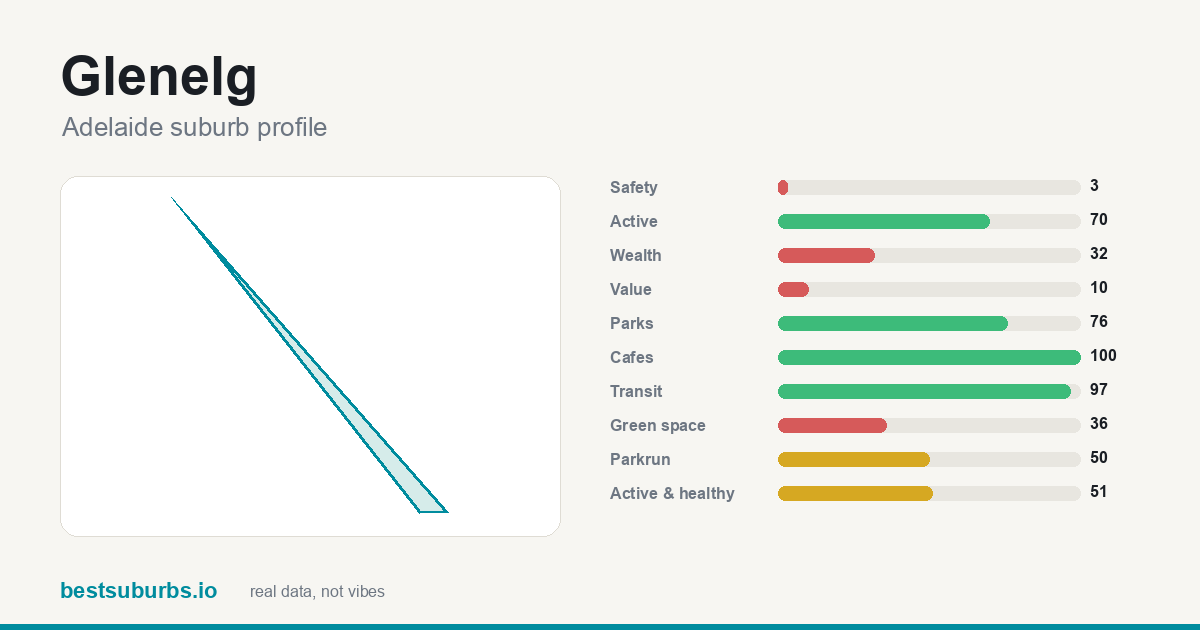 Glenelg — cafés 100/100, transit 97/100, activity 70/100
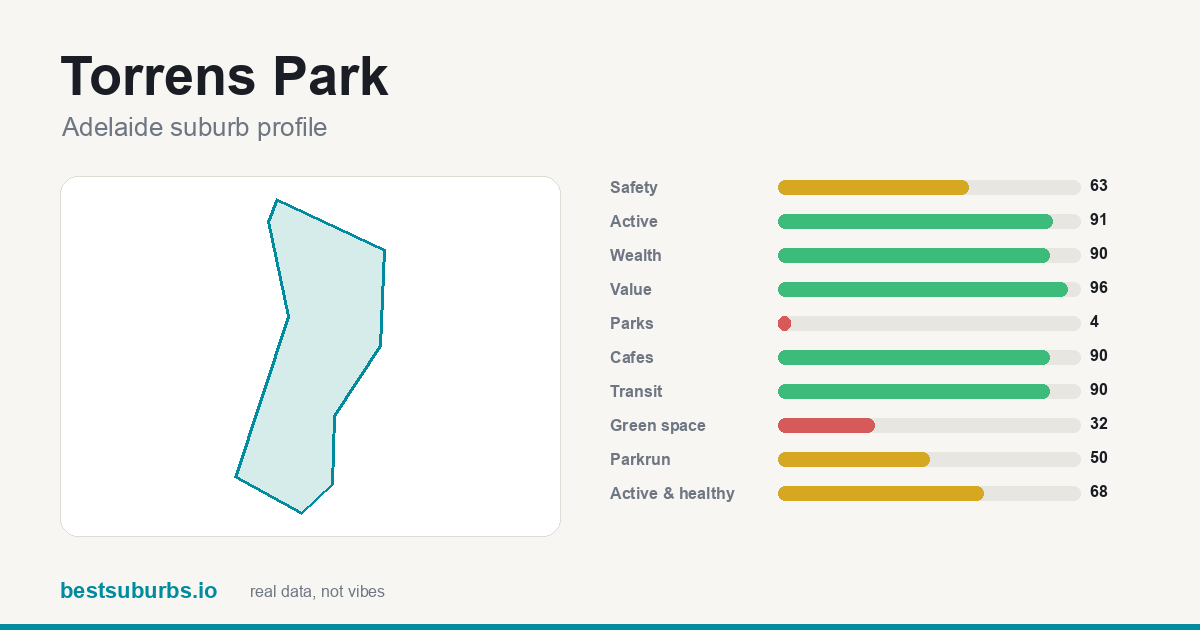 Torrens Park — cafés 90/100, transit 83/100, activity 91/100
See the full what are the best inner-city & lifestyle suburbs in Adelaide? ranking →
Which are the up-and-coming (next booming) suburbs in Adelaide?
Nobody can know which Adelaide suburbs will boom next, and we do not forecast. The closest honest answer from official sale data: of the 156 Adelaide suburbs we rank with 10+ house sales, these have a median house price at or below the middle suburb ($988,625) and grew fastest over the past year: Rosewater (+26.3% to $965,000), Hackham West (+23.4% to $785,000), Paralowie (+22.3% to $819,500), Ingle Farm (+21.8% to $895,000), Elizabeth Park (+21.4% to $680,000). Source: SA Government Metropolitan Median House Sales, April–June 2026 quarter (2Q 2026). Past growth is not a prediction.
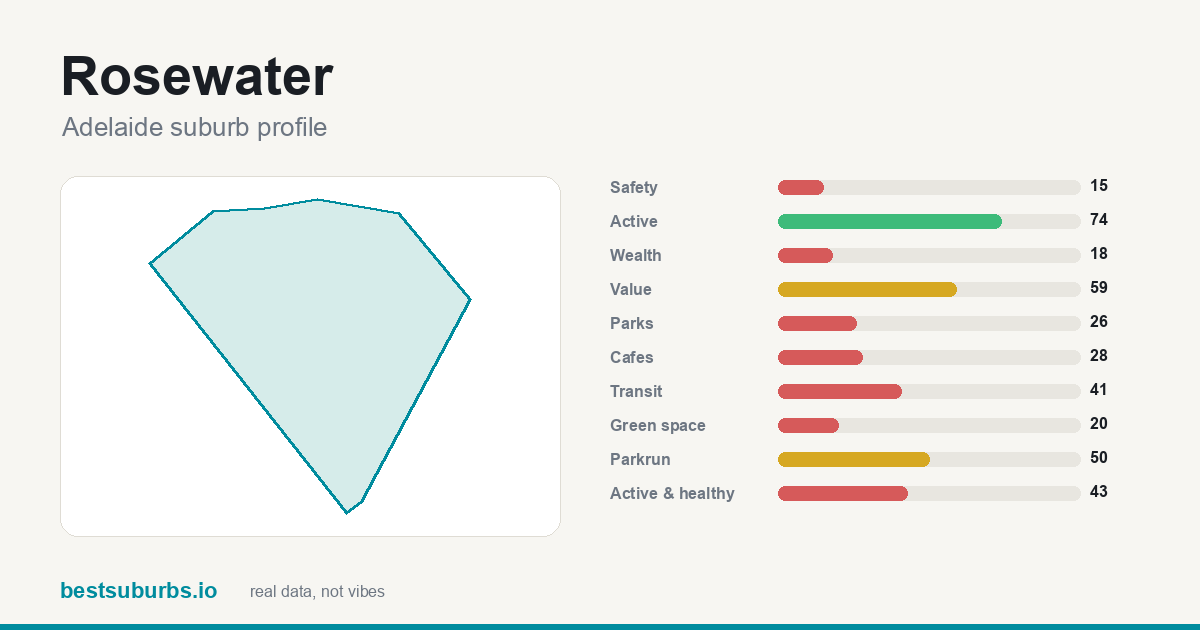 Rosewater — house median $965,000, +26.3% in a year (14 sales)
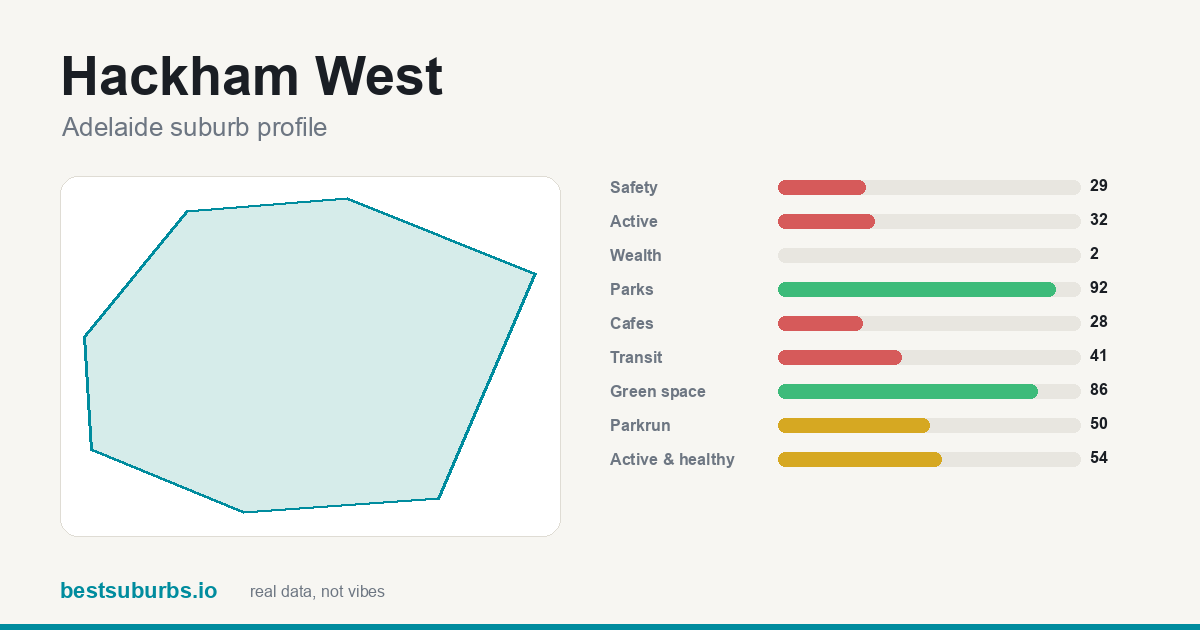 Hackham West — house median $785,000, +23.4% in a year (16 sales)
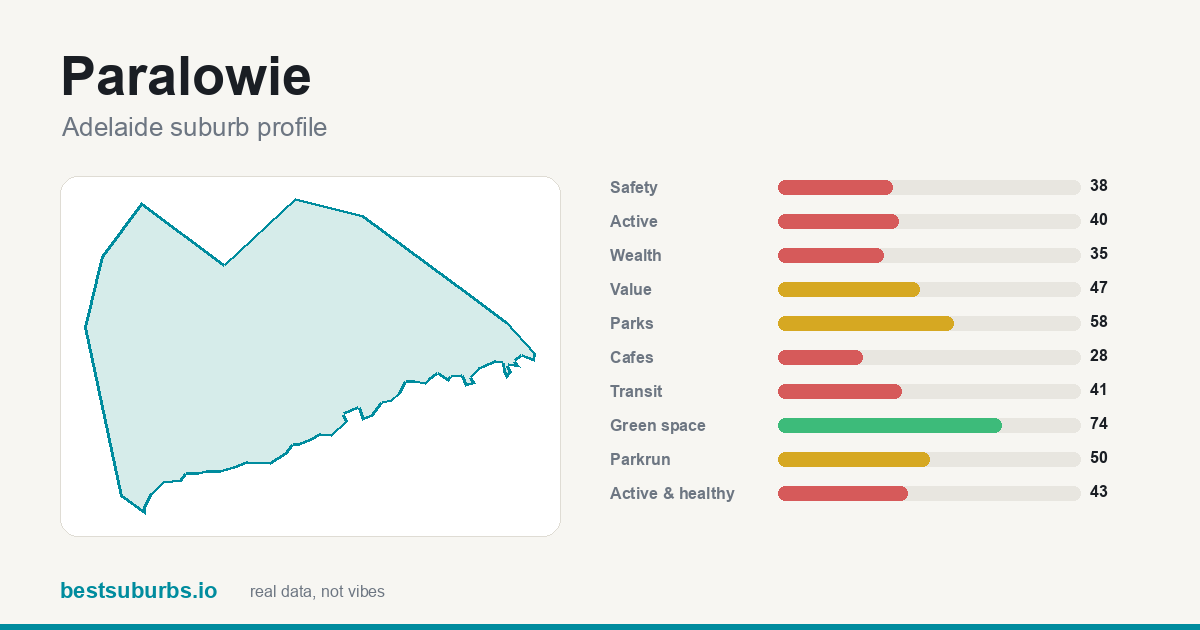 Paralowie — house median $819,500, +22.3% in a year (74 sales)
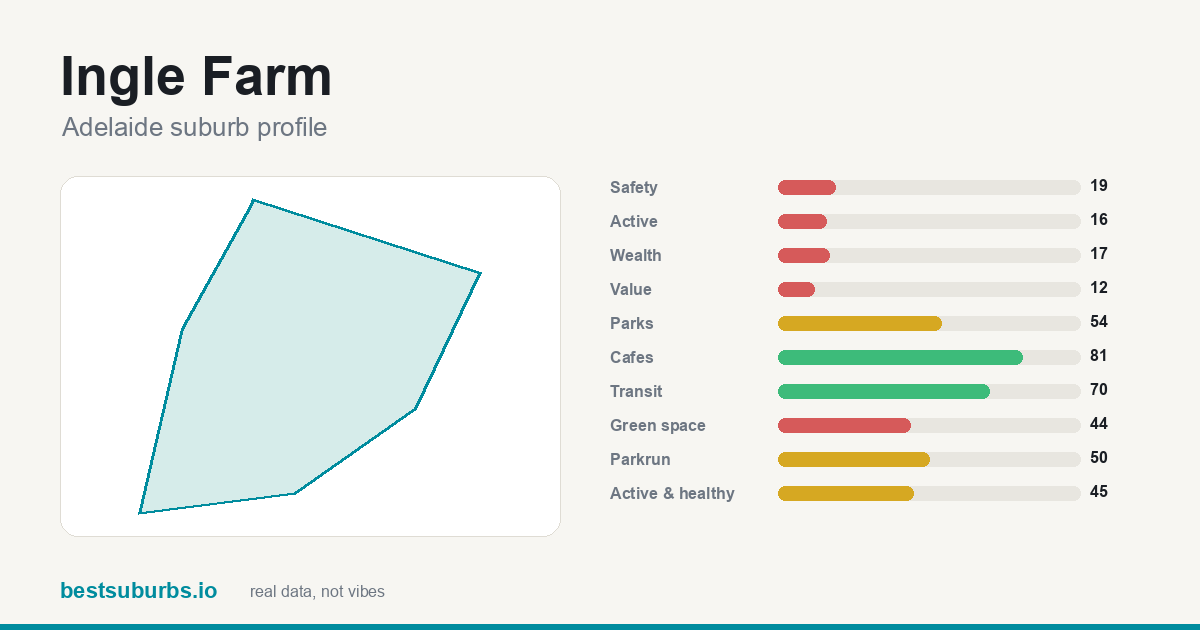 Ingle Farm — house median $895,000, +21.8% in a year (49 sales)
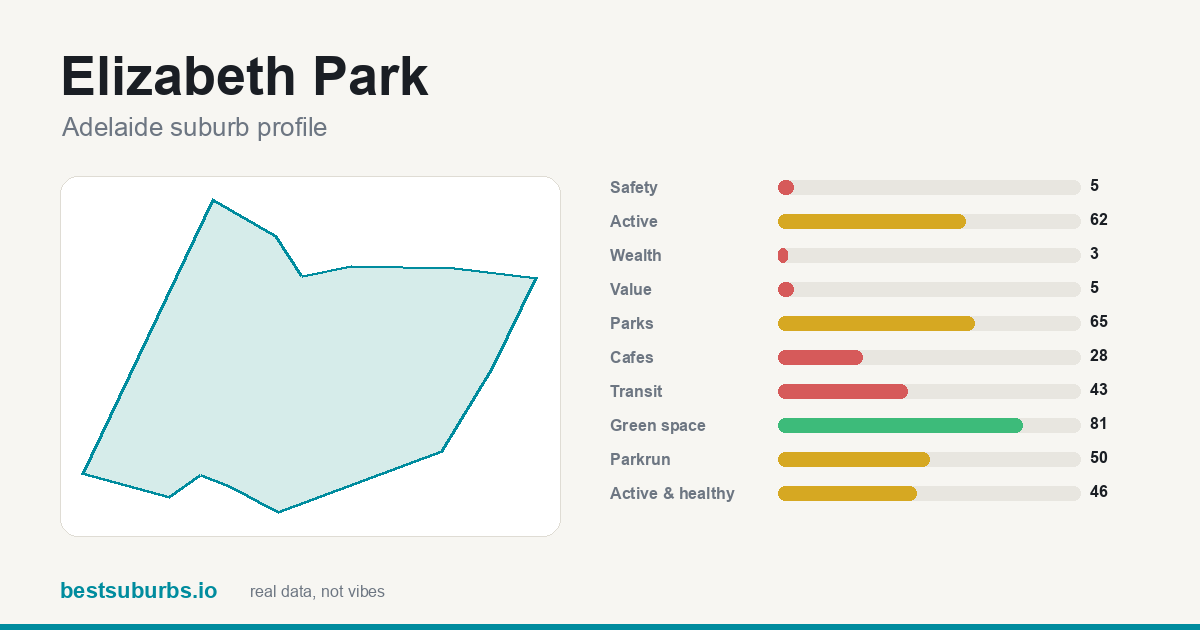 Elizabeth Park — house median $680,000, +21.4% in a year (19 sales)
See the full fastest-growing suburbs in Adelaide ranking →
Frequently asked questions
What is the best suburb in Adelaide for families?
Wynn Vale ranks highest for families in Adelaide, with a safety score of 85/100, a parks score of 94/100 and a green space score of 94/100.
What is the safest suburb in Adelaide?
Glenalta has the highest safety score in Adelaide (100/100), with 4 recorded offences per 1,000 residents.
What is the cheapest suburb to rent in Adelaide?
Novar Gardens has the lowest median rent in our Adelaide dataset, at $165/week (ABS Census 2021).
What is the best suburb in Adelaide for lifestyle and cafés?
Adelaide leads Adelaide for lifestyle, with a café score of 100/100 and a transit score of 87/100.
What are the up-and-coming suburbs in Adelaide?
Nobody can know which Adelaide suburbs will boom next, and we do not forecast. The closest honest answer from official sale data: of the 156 Adelaide suburbs we rank with 10+ house sales, these have a median house price at or below the middle suburb ($988,625) and grew fastest over the past year: Rosewater (+26.3% to $965,000), Hackham West (+23.4% to $785,000), Paralowie (+22.3% to $819,500), Ingle Farm (+21.8% to $895,000), Elizabeth Park (+21.4% to $680,000). Source: SA Government Metropolitan Median House Sales, April–June 2026 quarter (2Q 2026). Past growth is not a prediction.
How are Adelaide suburbs ranked?
Every suburb gets a 0–100 percentile score across up to 10 signals — safety (official crime statistics), activity (open GPS-activity traces), value (income vs rent), parks, green space, cafés, transit, wealth, parkrun proximity and a healthy/active composite. You set the weights with the sliders above; the ranking re-orders live. Full method: bestsuburbs.io/methodology.