How this works
The viral "Strava heatmap = good suburb" trick has a real insight buried in it — places where people run, ride and walk at night are usually places people feel safe. But heat lines alone mostly show where fit people live, and they happily run straight through high-crime pockets. So we treat activity as one signal of five, and back it with official data.
🏃 Activity
Density of public GPS traces (OpenStreetMap, ODbL) plus gyms, ovals, pools and sports facilities per km². The glowing map layer is this data, rendered raw.
🛡️ Safety
Criminal incidents recorded per 1,000 residents, latest year, from Victoria's Crime Statistics Agency — per suburb, not per council.
💰 Value
Median household income vs median rent (ABS Census 2021). High score = your rent buys more suburb than it should.
🏷️ Sale prices
Sale prices: Victorian Property Sales Report, October–December 2025 quarter — © State of Victoria (Department of Transport and Planning / Valuer-General Victoria), Victorian Property Sales Report, CC BY 4.0. Quarterly median of sales settled in the quarter, per suburb. Figures marked as low-volume rest on fewer than 10 sales that quarter.
🌳 Parks & ☕ Cafés
OpenStreetMap park and café density per km², blended 50/50 with the same counts normalised per 1,000 residents so both crowded inner suburbs and sparser leafy ones can score well.
💪 Active & Healthy
A composite of fitness-infrastructure density (gyms/ovals/pools per capita), proximity + attendance at the nearest parkrun event, % of the suburb within 400m of a park, and café density per capita. Off by default — drag its slider up to weight it into the ranking.
🧮 The blend
Every suburb gets a 0–100 percentile per signal. Your sliders weight the signals; the headline number is the weighted blend. No paid placements, ever.
Top 10 suburbs in Melbourne (October 2026)
Updated 11 October 2026 · one sentence of real reasons per suburb, from the data on this page.
- Eaglemont ★ 84
At #1, Eaglemont combines a recorded crime rate of about 35 offences per 1,000 residents (safety score 80/100) and 86% of it within 400 m of a park, and 11.1 ha of parkland per 1,000 residents.
- Eltham North ★ 79
Eltham North takes #2 on a recorded crime rate of about 14 offences per 1,000 residents (safety score 99/100), with 100% of it within 400 m of a park, and 3 government primary schools and 1 secondary inside the suburb.
- Diamond Creek ★ 79
#3 Diamond Creek — a recorded crime rate of about 29 offences per 1,000 residents (safety score 90/100), plus 3 government primary schools and 1 secondary inside the suburb, and a median house price of $1.06m (Oct–Dec 2025).
- Canterbury ★ 79
What lifts Canterbury to #4 is a recorded crime rate of about 33 offences per 1,000 residents (safety score 86/100); it also has 4 government primary schools and 5 secondary inside the suburb, and 84% of it within 400 m of a park.
- St Helena ★ 78
What lifts St Helena to #5 is a recorded crime rate of about 28 offences per 1,000 residents (safety score 91/100); it also has 100% of it within 400 m of a park, and 6.4 ha of parkland per 1,000 residents.
- Eltham ★ 78
Eltham takes #6 on a recorded crime rate of about 35 offences per 1,000 residents (safety score 80/100), with 3 government primary schools and 2 secondary inside the suburb, and 77% of it within 400 m of a park.
- Taylors Hill ★ 77
#7 Taylors Hill — a recorded crime rate of about 20 offences per 1,000 residents (safety score 96/100), plus 100% of it within 400 m of a park, and 2 government primary schools and 1 secondary inside the suburb.
- Yarrambat ★ 74
At #8, Yarrambat combines a recorded crime rate of about 27 offences per 1,000 residents (safety score 91/100) and 1 government primary school inside the suburb, and median rent of $450 a week.
- Glen Iris ★ 74
What lifts Glen Iris to #9 is a recorded crime rate of about 36 offences per 1,000 residents (safety score 77/100); it also has 6 government primary schools and 2 secondary inside the suburb, and 82% of it within 400 m of a park.
- Seabrook ★ 73
What lifts Seabrook to #10 is a recorded crime rate of about 24 offences per 1,000 residents (safety score 96/100); it also has 100% of it within 400 m of a park, and 4.1 ha of parkland per 1,000 residents.
What are the best suburbs in Melbourne for families?
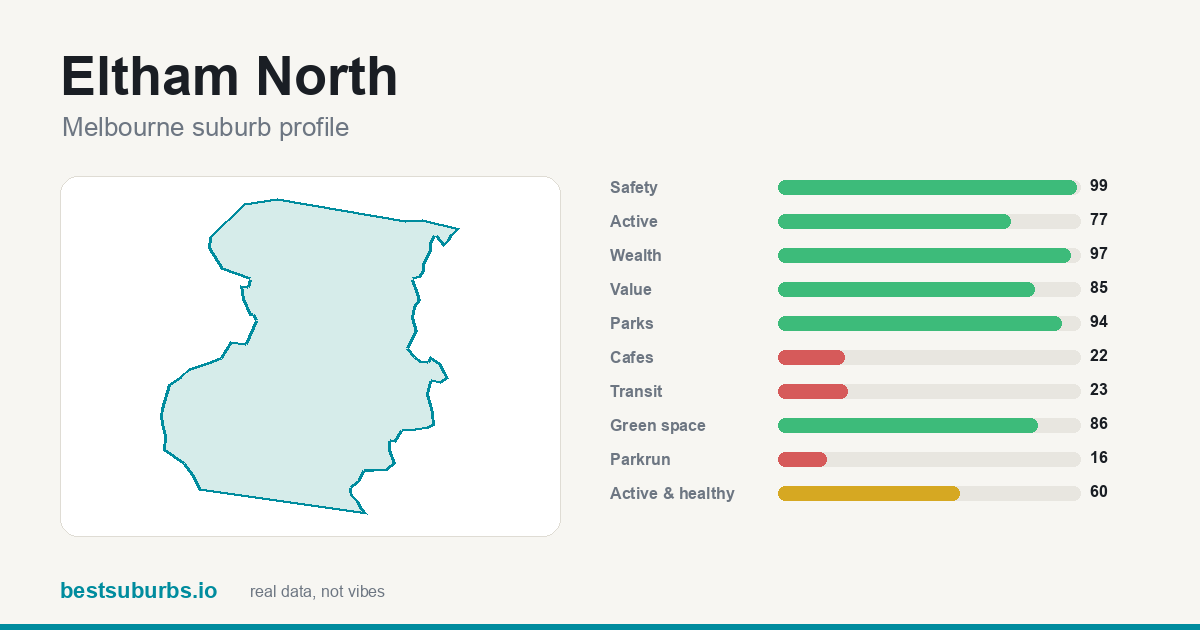 Eltham North — safety 99/100, parks 94/100, green space 86/100
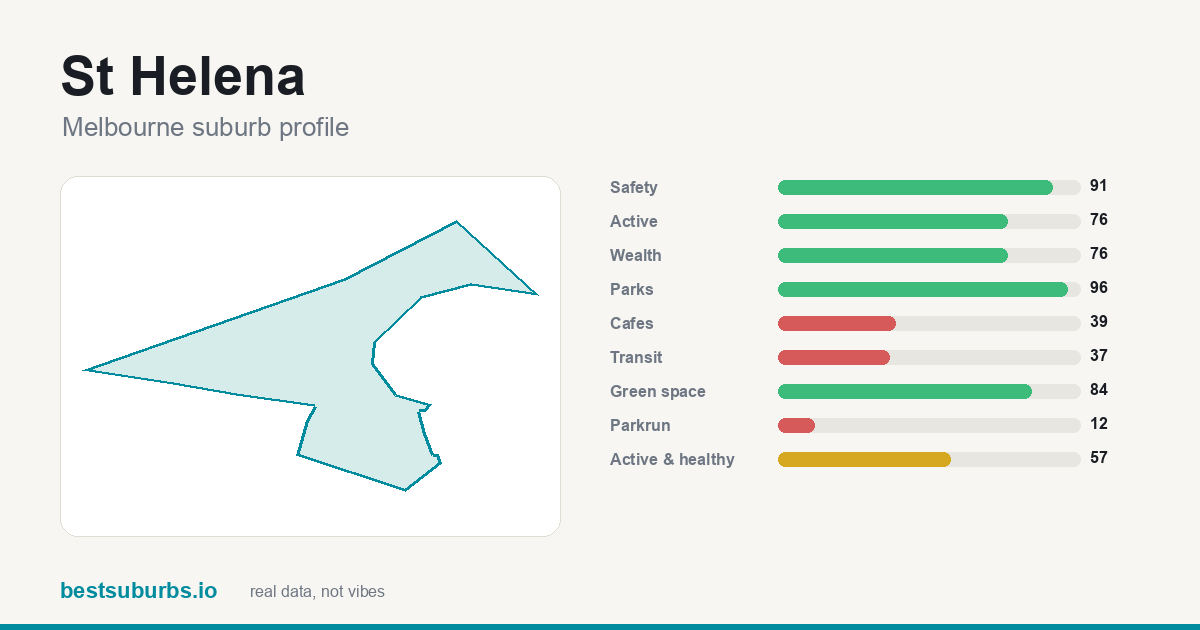 St Helena — safety 91/100, parks 96/100, green space 84/100
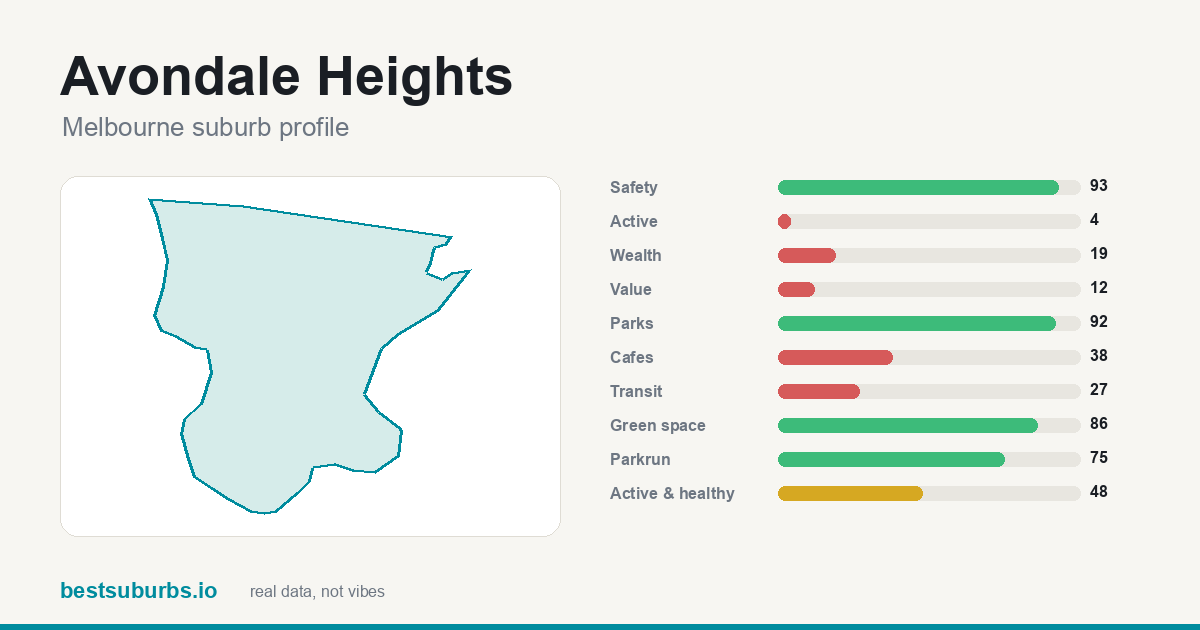 Avondale Heights — safety 93/100, parks 92/100, green space 86/100
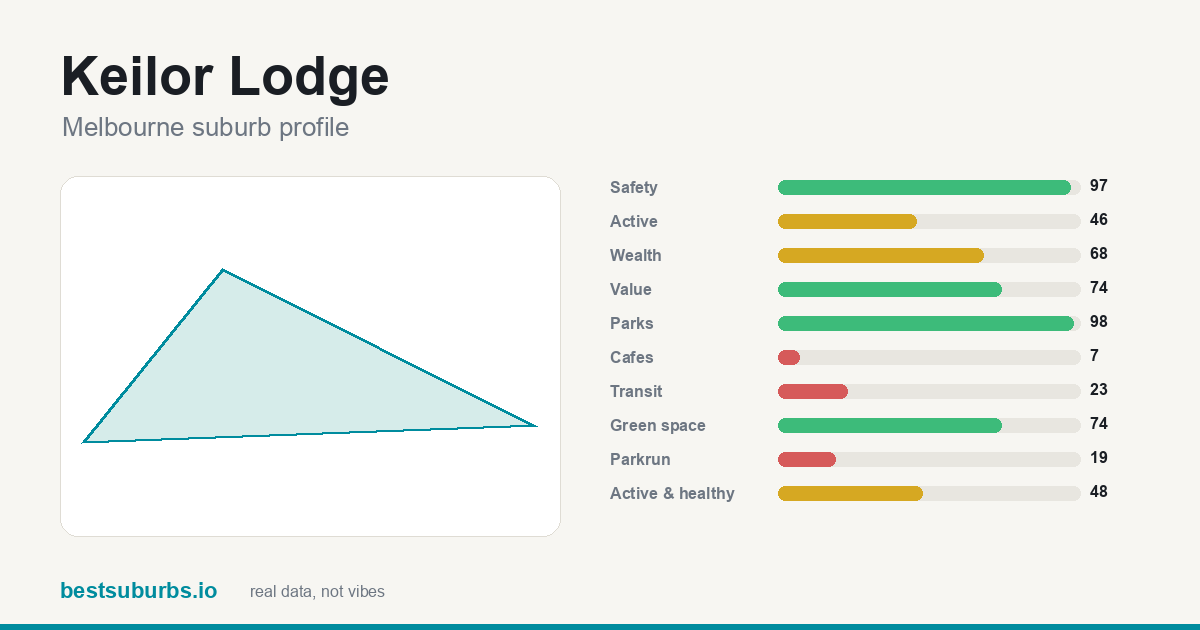 Keilor Lodge — safety 97/100, parks 98/100, green space 74/100
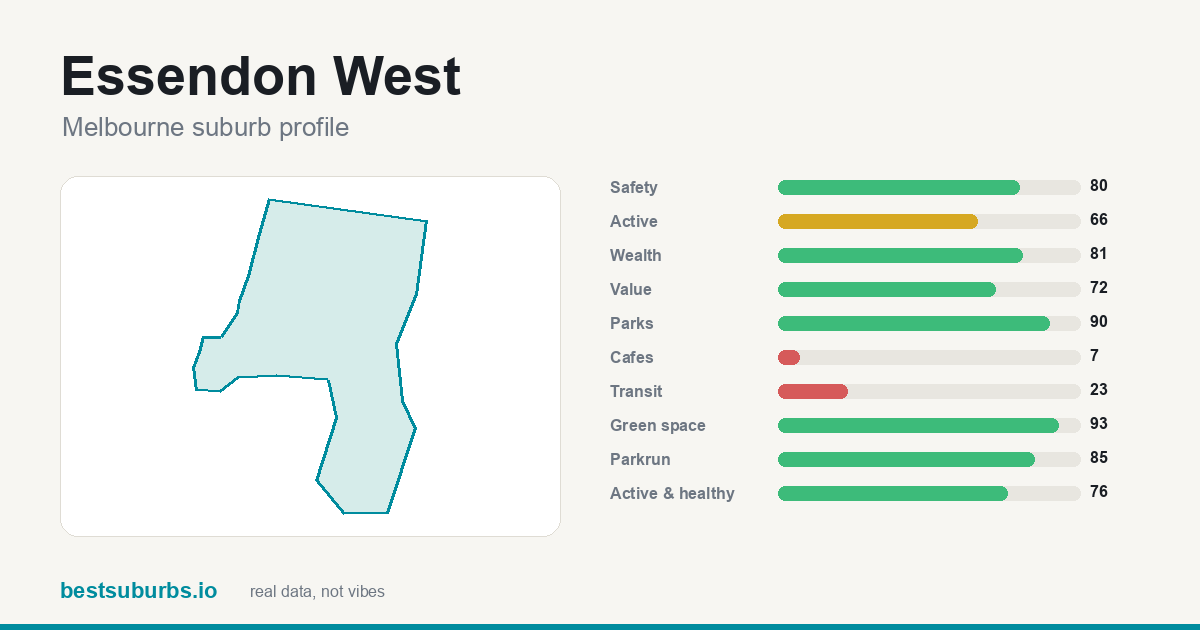 Essendon West — safety 80/100, parks 90/100, green space 93/100
See the full what are the best suburbs in Melbourne for families? ranking →
What are the safest suburbs in Melbourne?
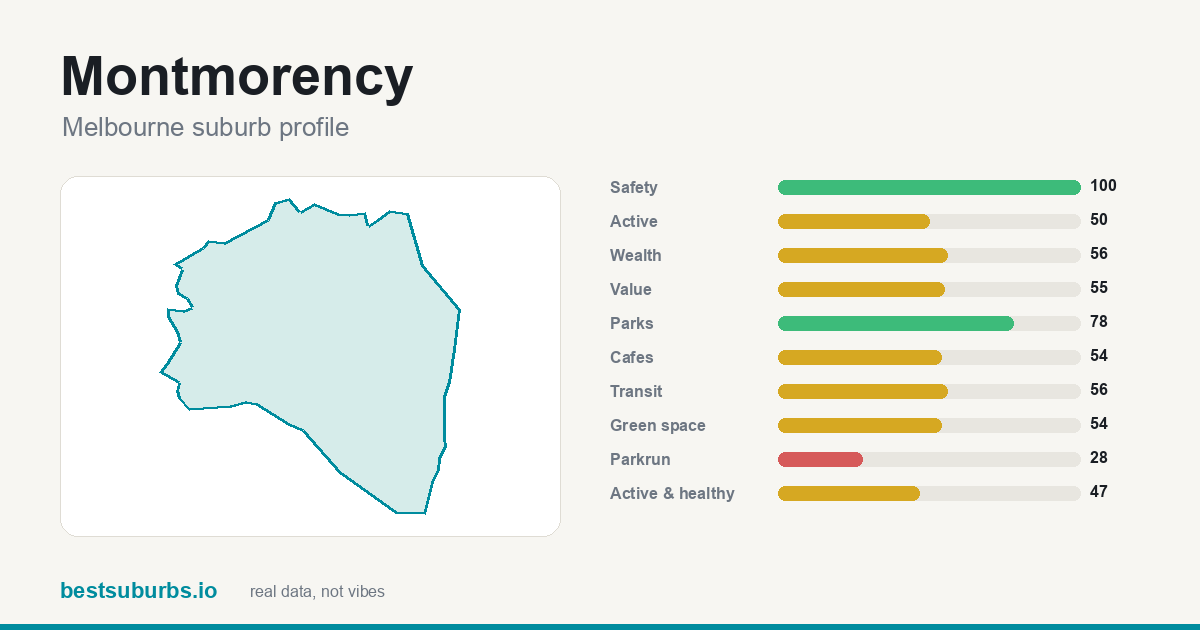 Montmorency — safety score 100/100, 13 recorded offences per 1,000 residents
- Eltham North — safety score 99/100, 14 recorded offences per 1,000 residents
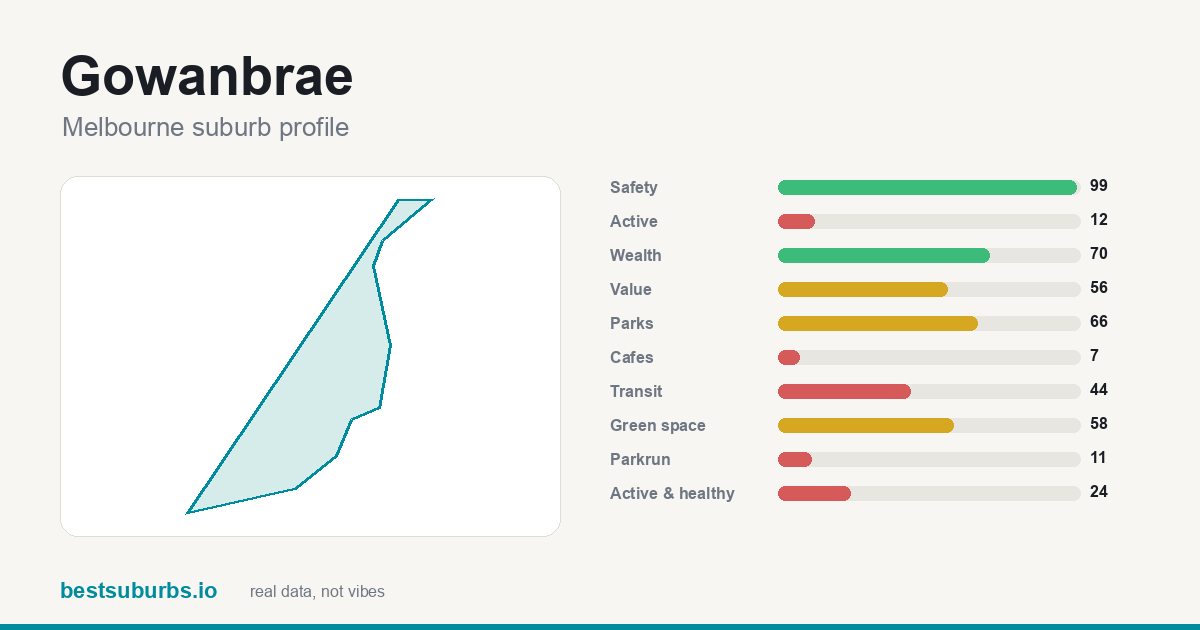 Gowanbrae — safety score 99/100, 16 recorded offences per 1,000 residents
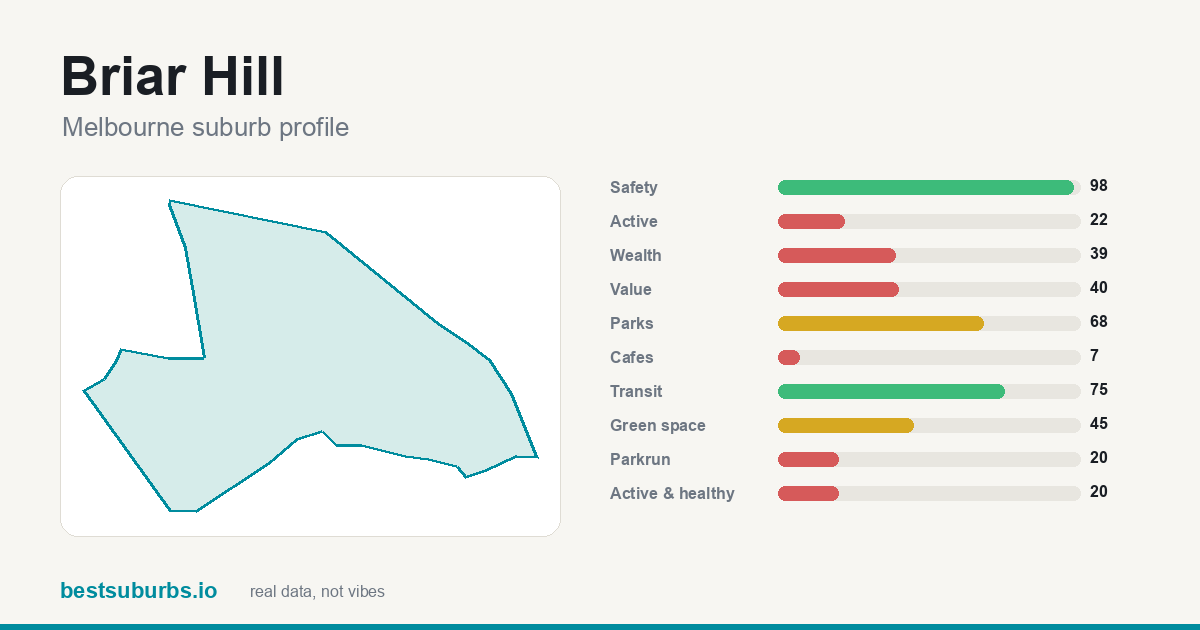 Briar Hill — safety score 98/100, 16 recorded offences per 1,000 residents
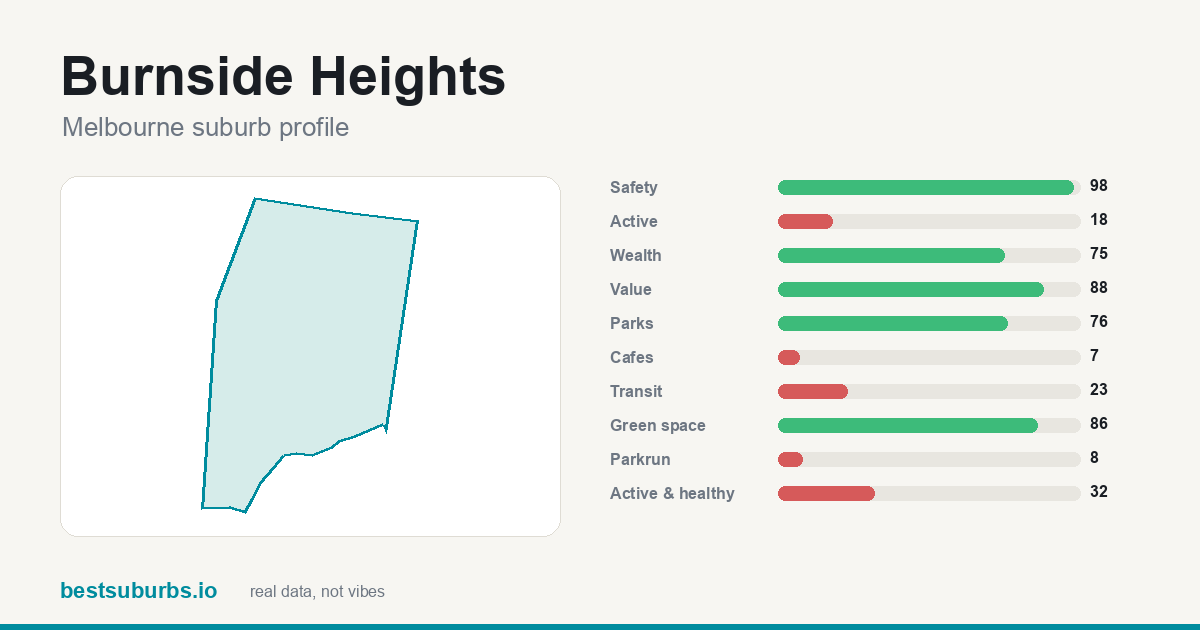 Burnside Heights — safety score 98/100, 17 recorded offences per 1,000 residents
See the full what are the safest suburbs in Melbourne? ranking →
Which Melbourne suburbs offer the best value?
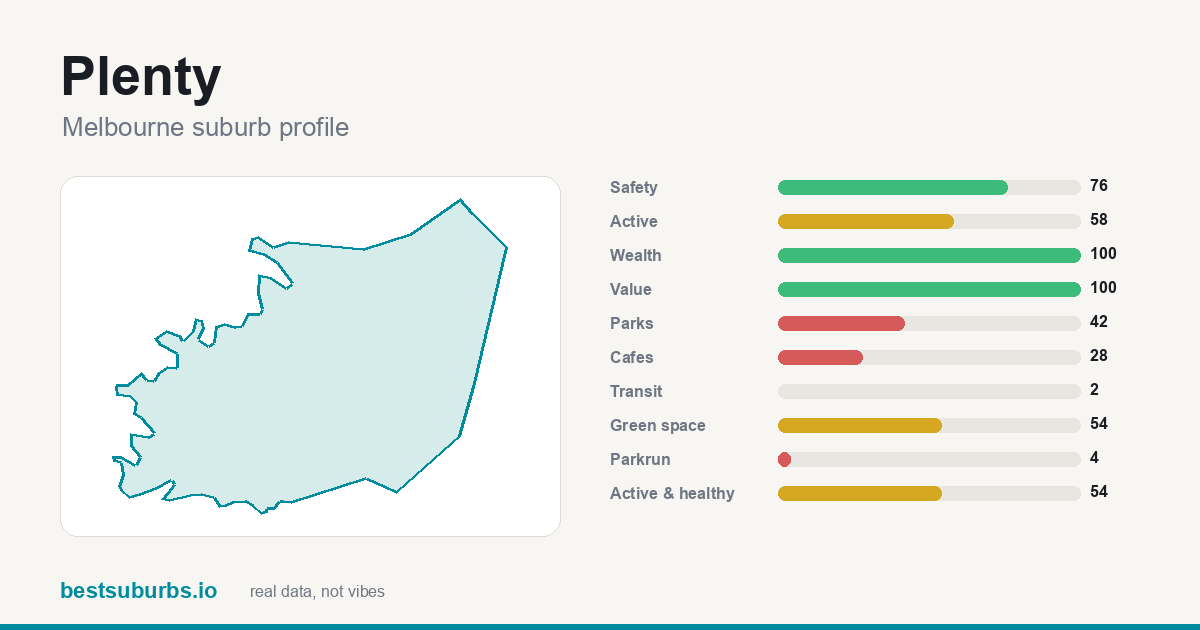 Plenty — value score 100/100, median rent $392/wk
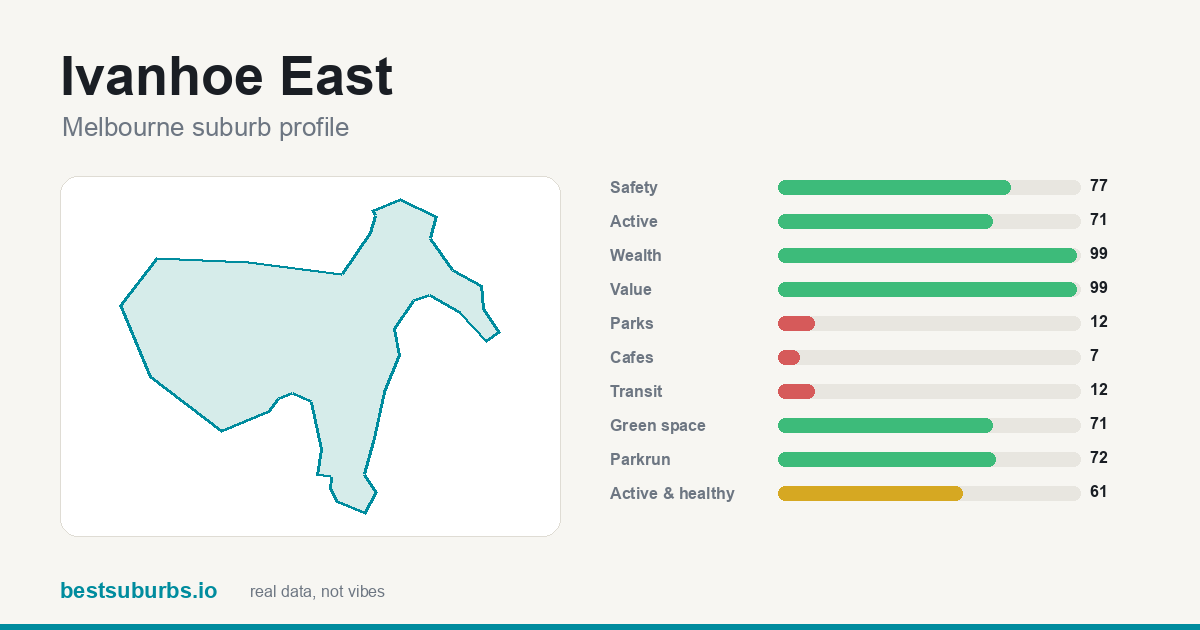 Ivanhoe East — value score 99/100, median rent $451/wk
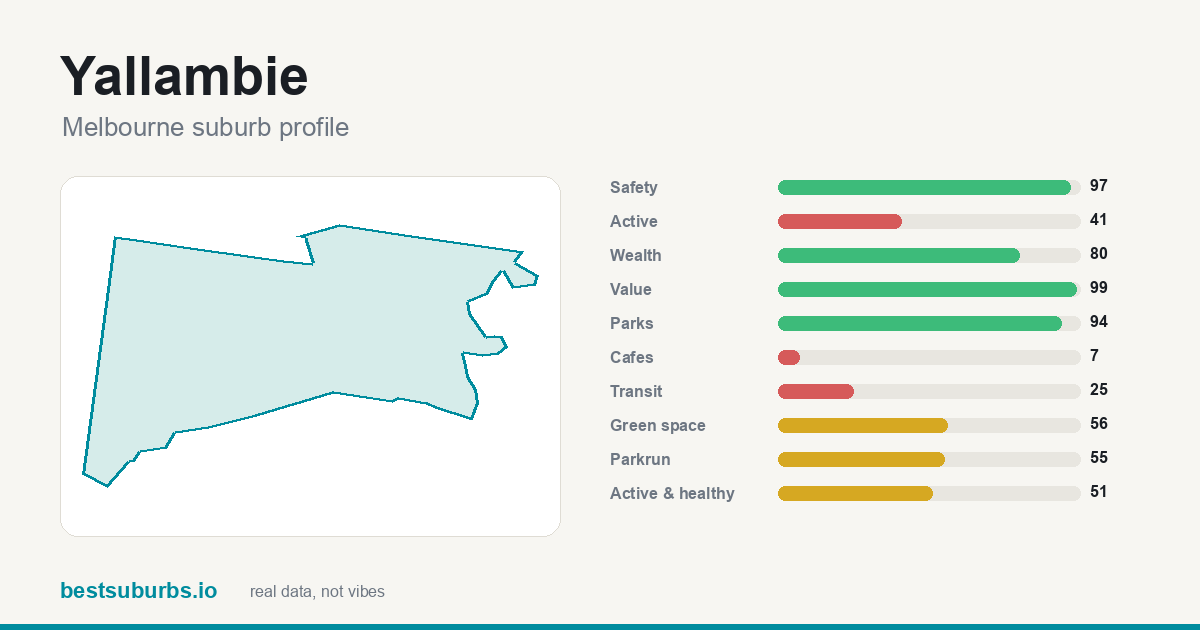 Yallambie — value score 99/100, median rent $340/wk
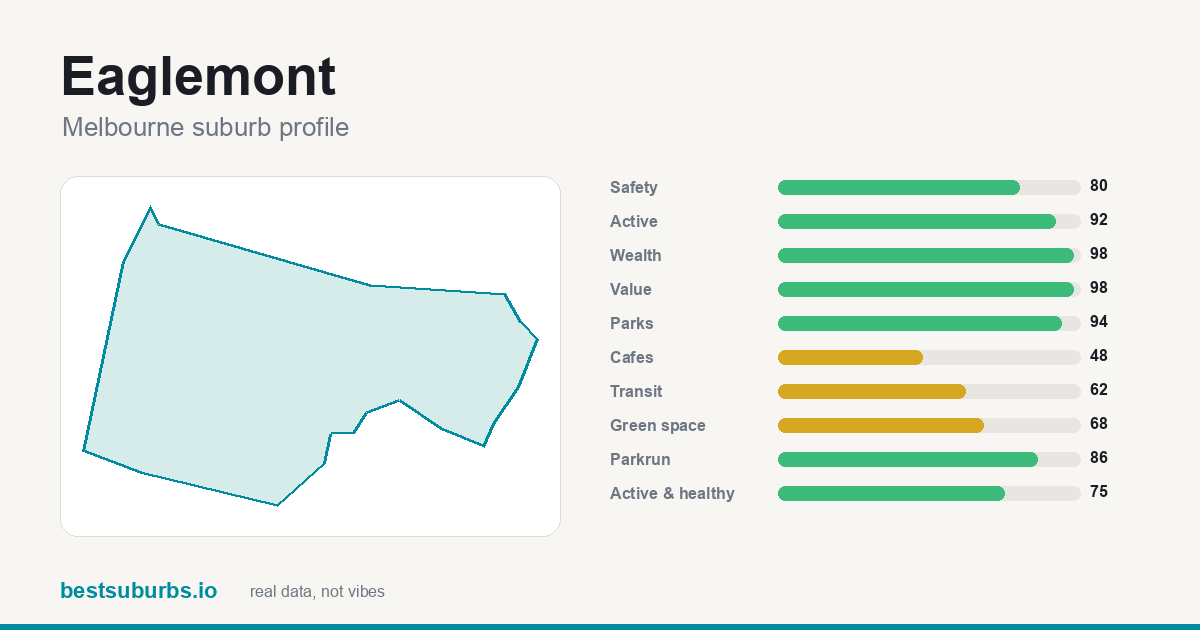 Eaglemont — value score 98/100, median rent $453/wk
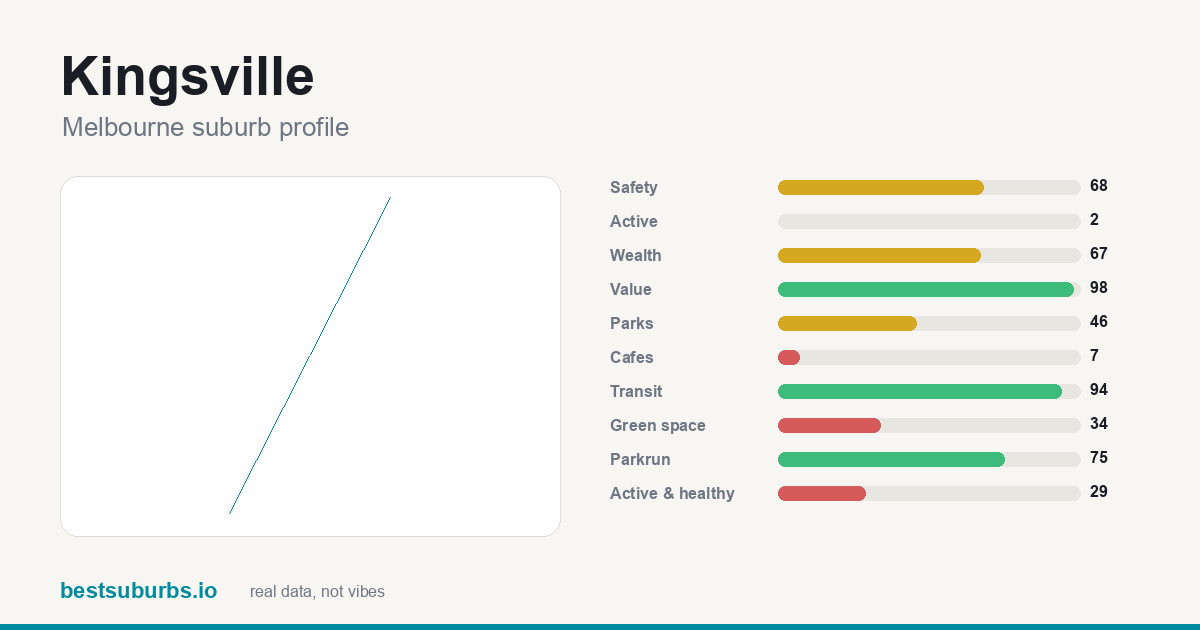 Kingsville — value score 98/100, median rent $355/wk
See the full which Melbourne suburbs offer the best value? ranking →
What are the best inner-city & lifestyle suburbs in Melbourne?
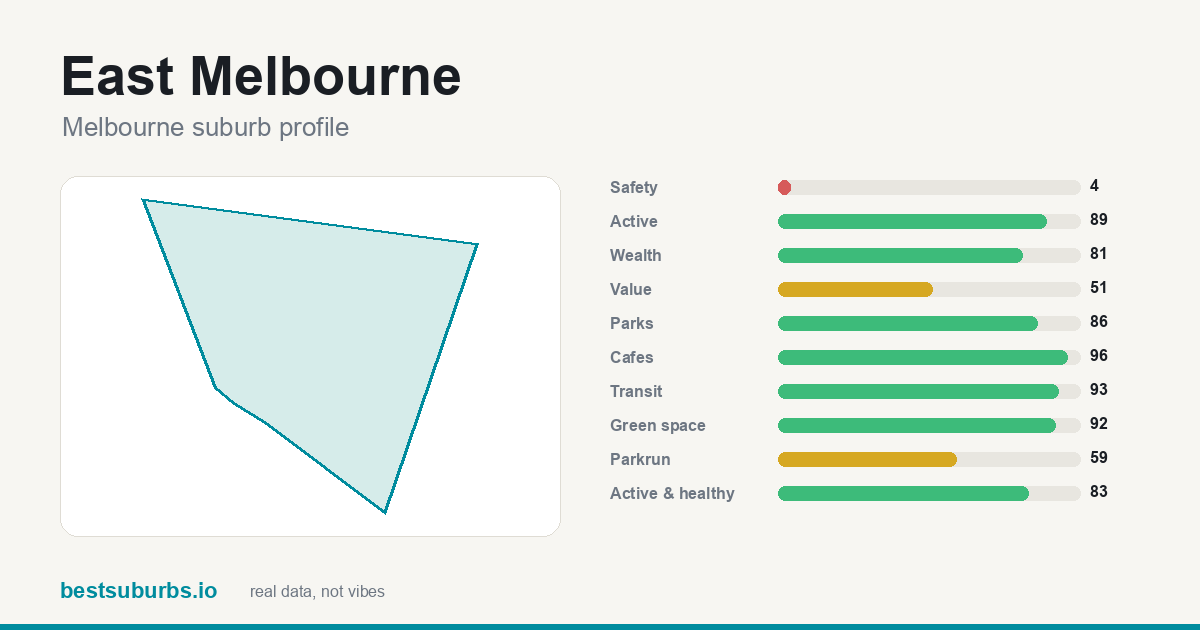 East Melbourne — cafés 96/100, transit 97/100, activity 89/100
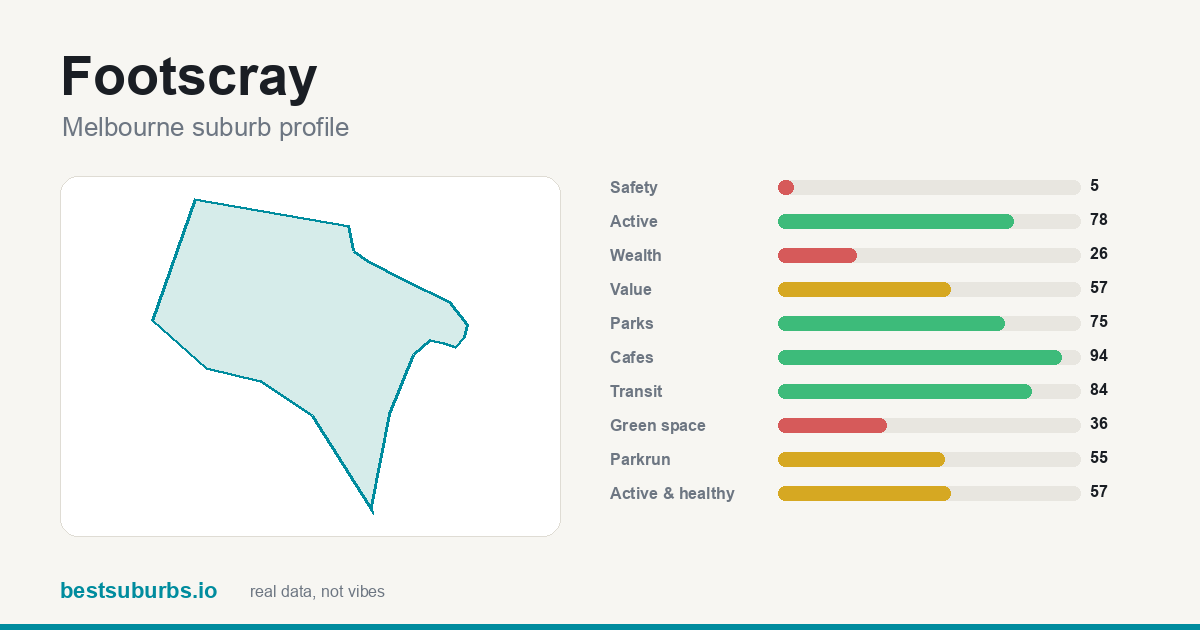 Footscray — cafés 94/100, transit 84/100, activity 78/100
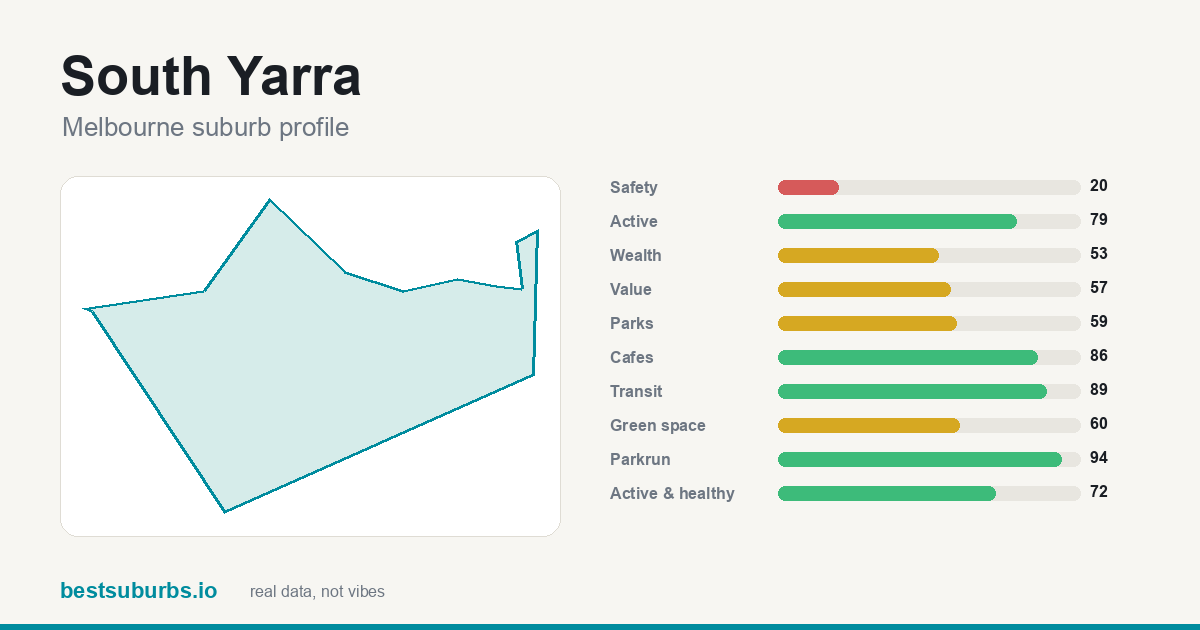 South Yarra — cafés 86/100, transit 89/100, activity 79/100
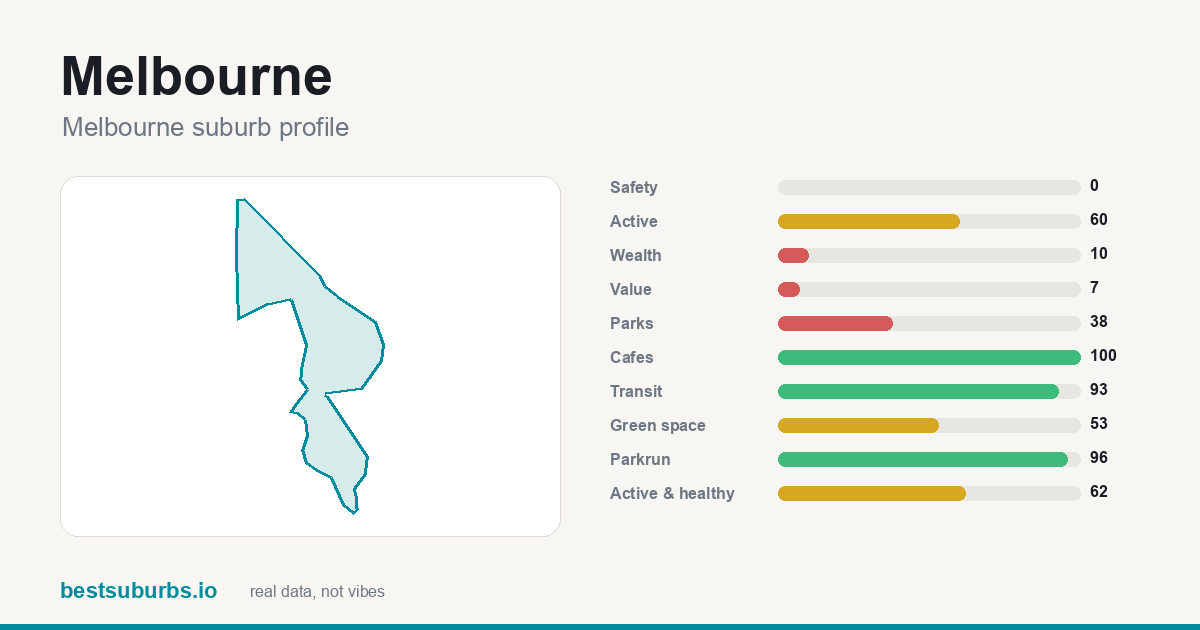 Melbourne — cafés 100/100, transit 93/100, activity 60/100
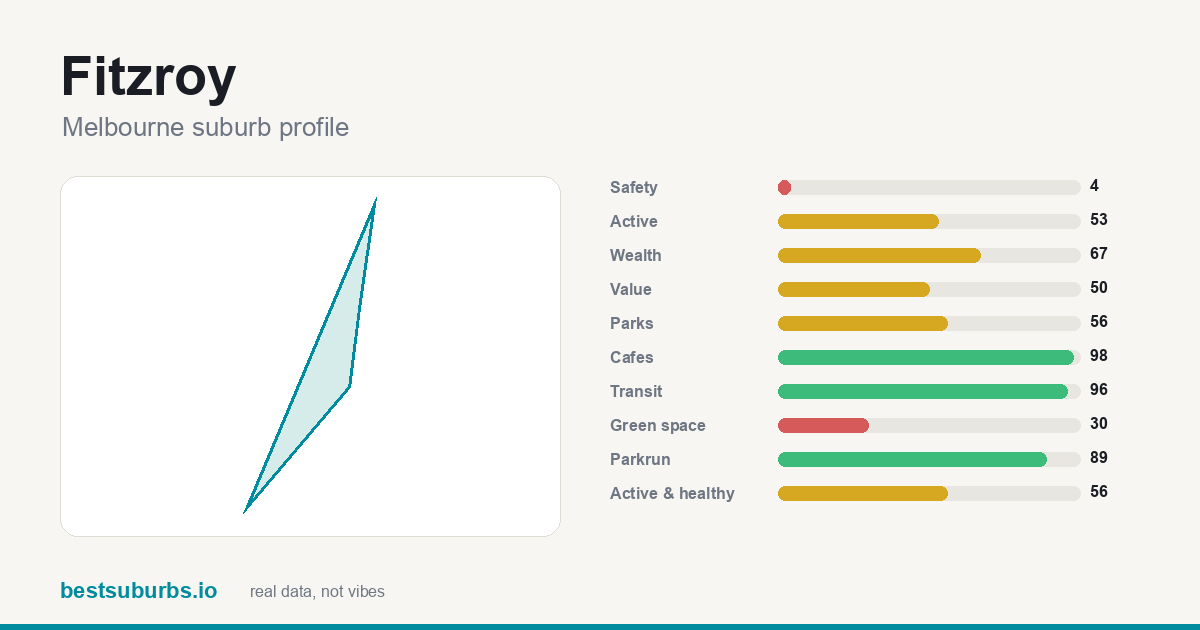 Fitzroy — cafés 98/100, transit 96/100, activity 53/100
See the full what are the best inner-city & lifestyle suburbs in Melbourne? ranking →
Frequently asked questions
What is the best suburb in Melbourne for families?
Eltham North ranks highest for families in Melbourne, with a safety score of 99/100, a parks score of 94/100 and a green space score of 86/100.
What is the safest suburb in Melbourne?
Montmorency has the highest safety score in Melbourne (100/100), with 13 recorded offences per 1,000 residents.
What is the cheapest suburb to rent in Melbourne?
St Helena has the lowest median rent in our Melbourne dataset, at $163/week (ABS Census 2021).
What is the best suburb in Melbourne for lifestyle and cafés?
East Melbourne leads Melbourne for lifestyle, with a café score of 96/100 and a transit score of 97/100.
How are Melbourne suburbs ranked?
Every suburb gets a 0–100 percentile score across up to 10 signals — safety (official crime statistics), activity (open GPS-activity traces), value (income vs rent), parks, green space, cafés, transit, wealth, parkrun proximity and a healthy/active composite. You set the weights with the sliders above; the ranking re-orders live. Full method: bestsuburbs.io/methodology.