Healthiest, most active suburbs in Melbourne
Where people genuinely walk, run and ride — measured, not claimed.
Albert Park (90/100), East Melbourne (86/100), Parkville (86/100) lead this ranking of 216 Melbourne suburbs.
By BestSuburbs research · Updated October 2026
Part of Melbourne suburb rankings · all Melbourne lists
Which Melbourne suburbs are the healthiest and most active?
How do the top 25 compare, measure by measure?
| # | Suburb | Activity heat / km² | Gyms + sport per 1,000 | Healthy score | Median house price |
|---|---|---|---|---|---|
| 1 | 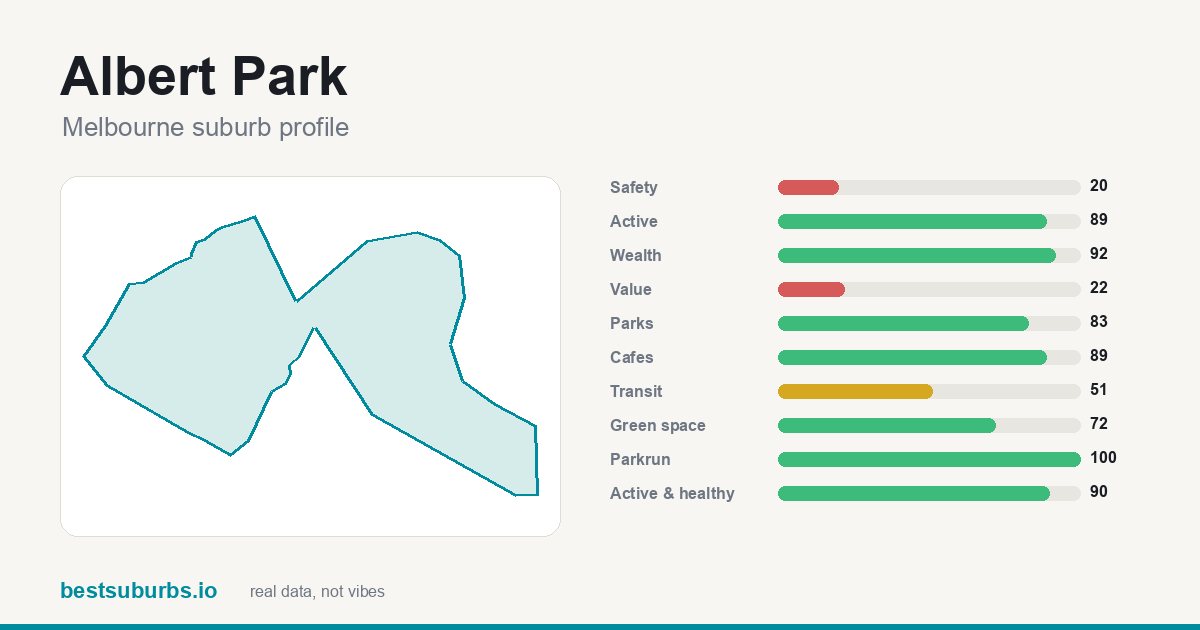 Albert Park Albert Park | — | 14.1 | 90 | $2,105,000 |
| 2 | 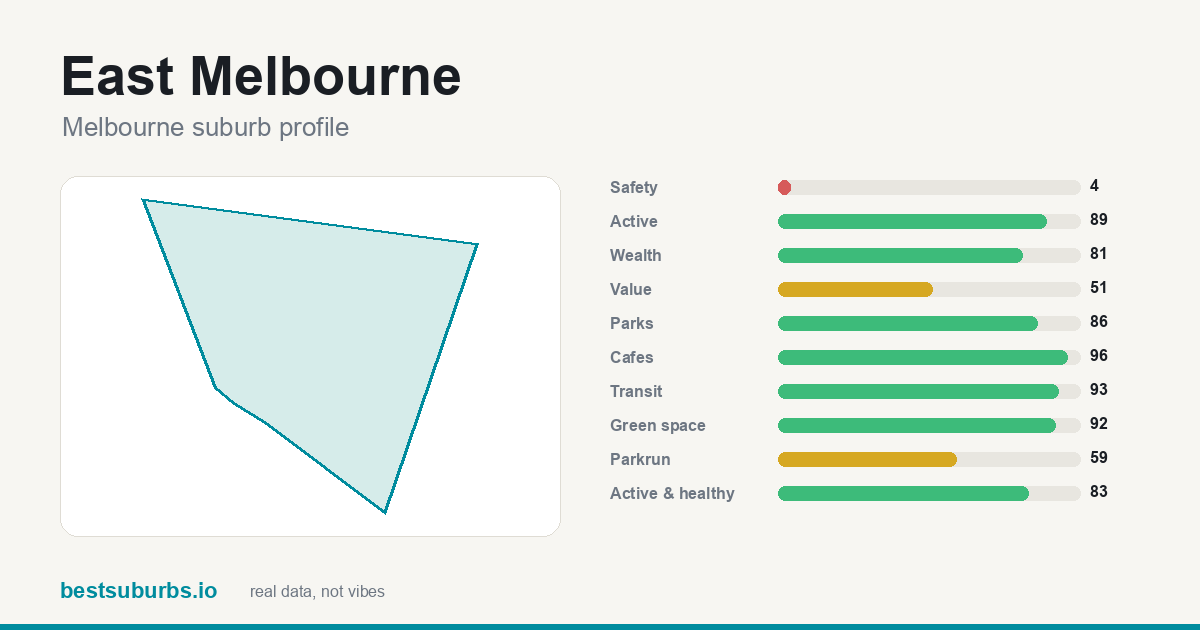 East Melbourne East Melbourne | — | 7.2 | 83 | $3,125,000 |
| 3 | 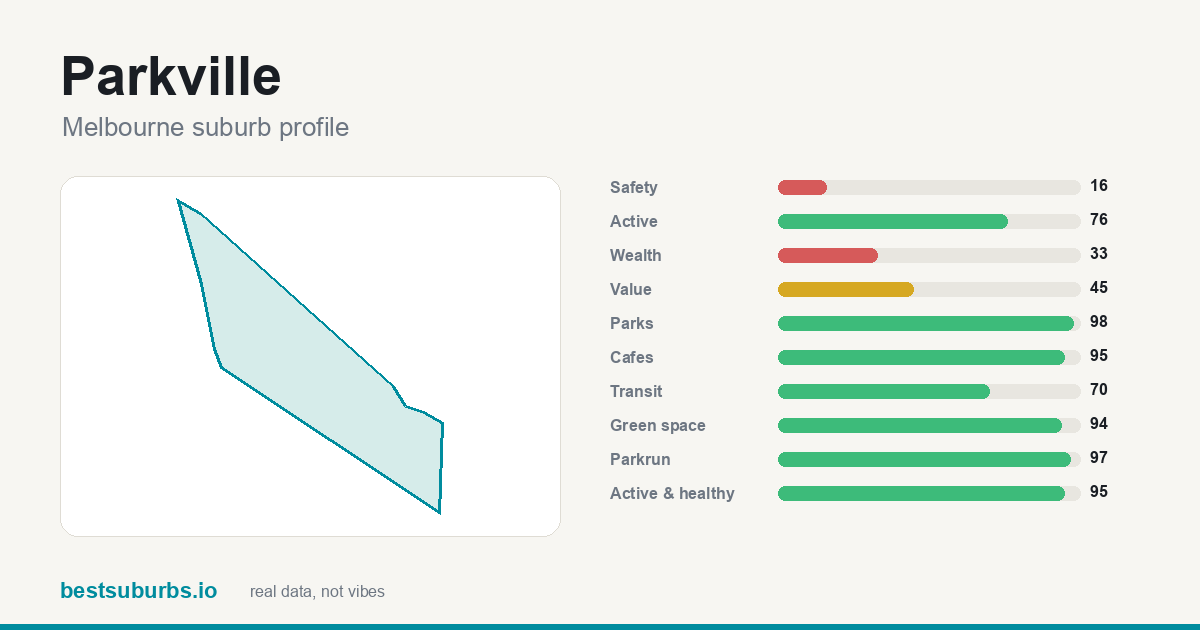 Parkville Parkville | — | 12.9 | 95 | $1,914,400 |
| 4 | 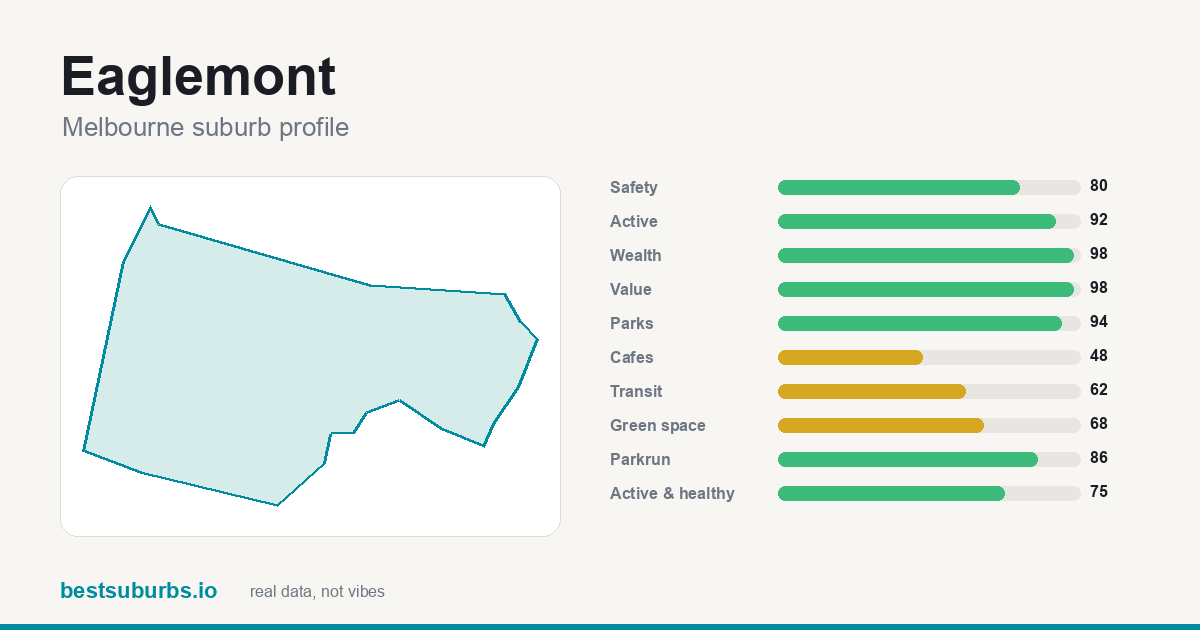 Eaglemont Eaglemont | — | 6.8 | 75 | $2,581,000 |
| 5 | 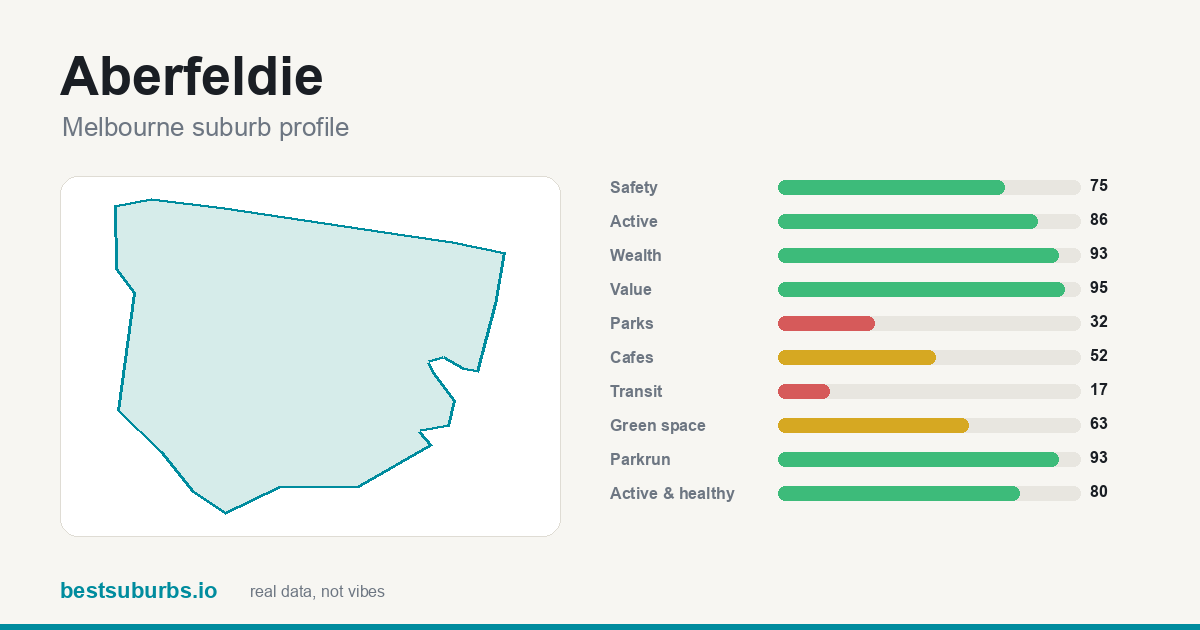 Aberfeldie Aberfeldie | — | 17.1 | 80 | $1,845,000 |
| 6 | 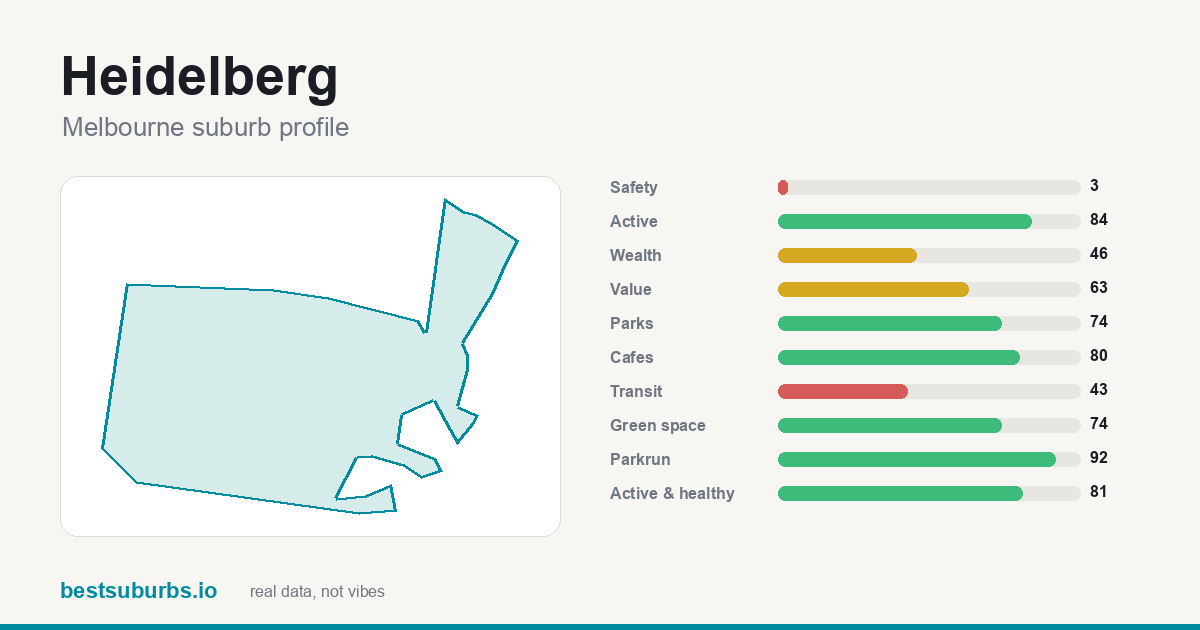 Heidelberg Heidelberg | — | 5.4 | 81 | $1,602,800 |
| 7 | 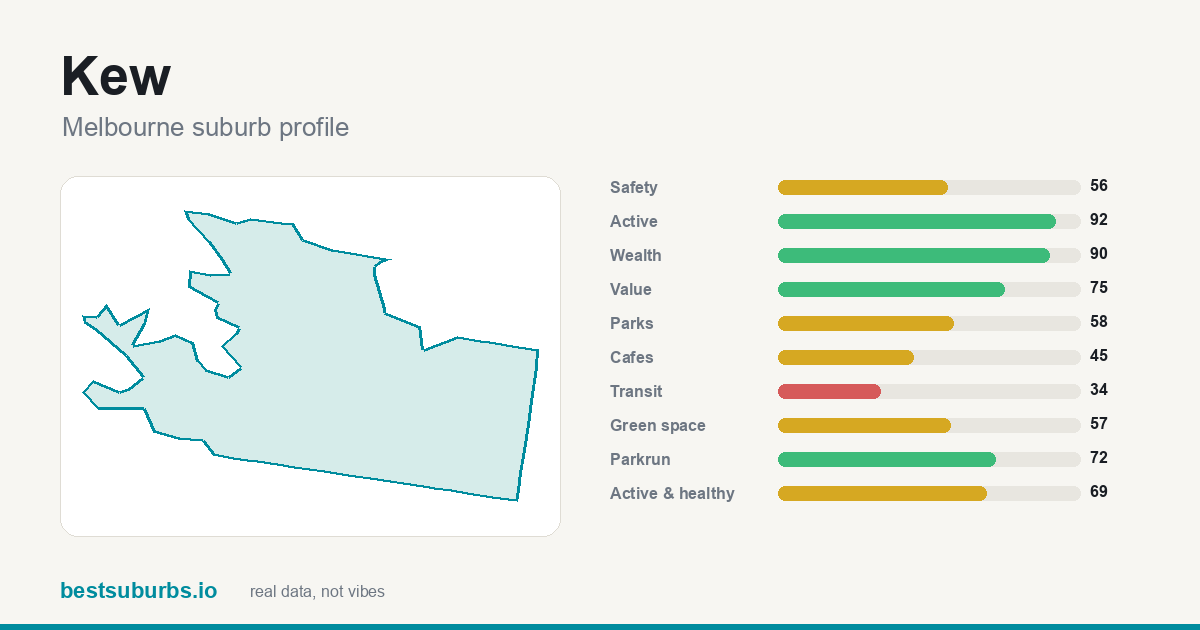 Kew Kew | — | 9.1 | 69 | $2,510,000 |
| 8 | 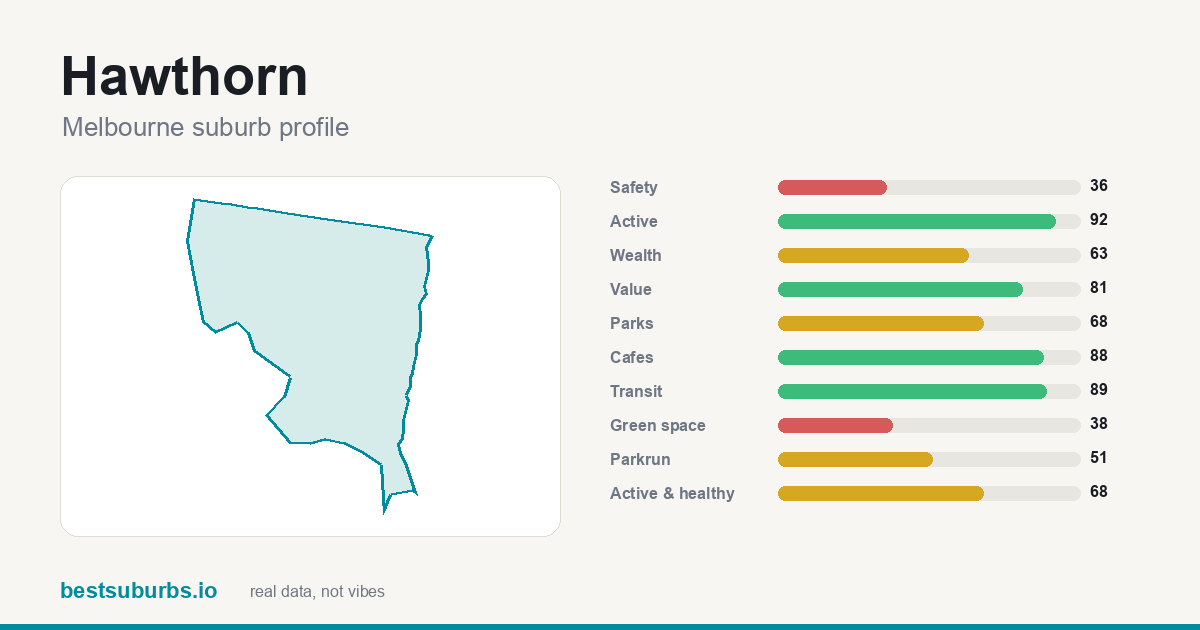 Hawthorn Hawthorn | — | 11.8 | 68 | $3,070,000 |
| 9 | 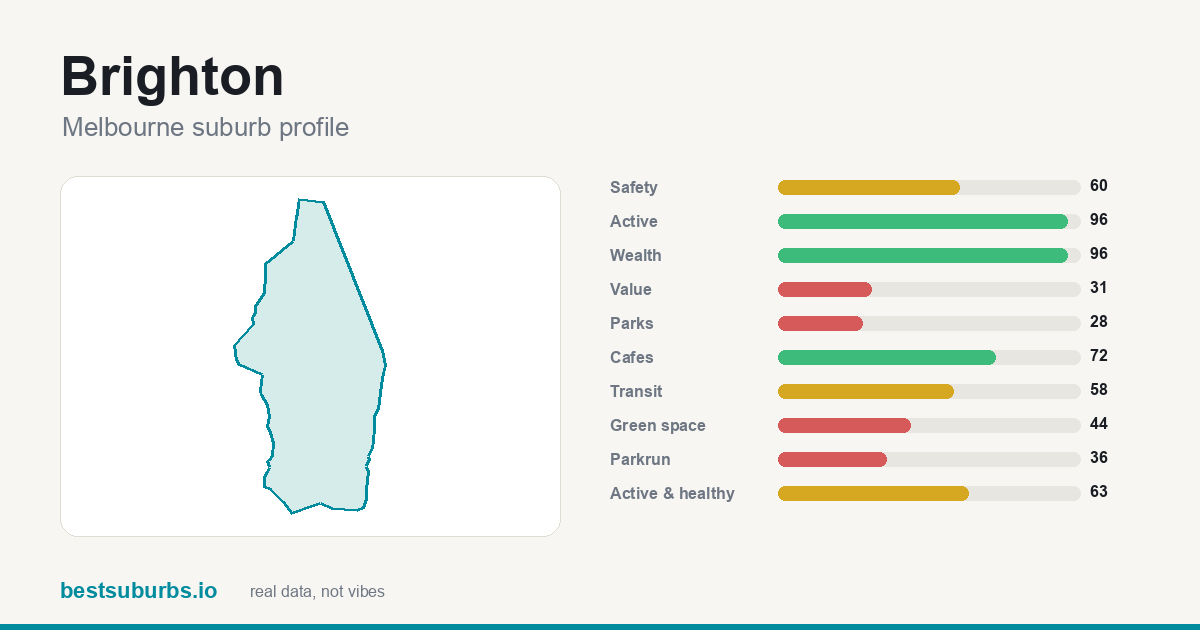 Brighton Brighton | — | 12.3 | 63 | $3,355,000 |
| 10 | 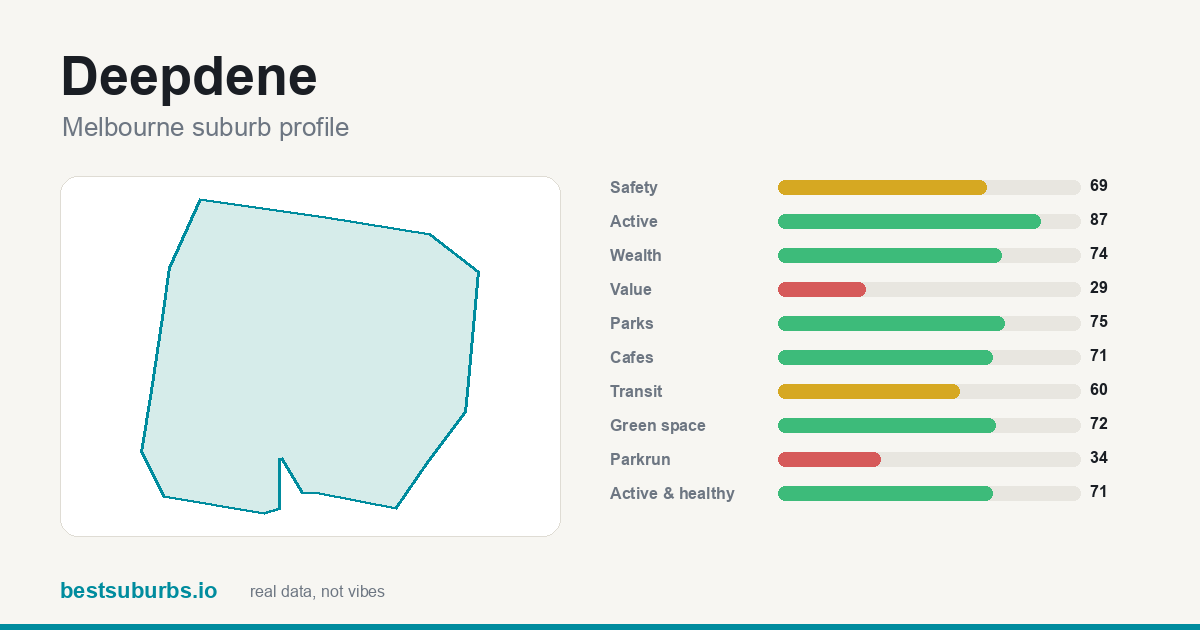 Deepdene Deepdene | — | 14.8 | 71 | $2,865,000 |
| 11 |  Clifton Hill Clifton Hill | — | 5.8 | 74 | $1,602,500 |
| 12 |  Templestowe Templestowe | — | 26.1 | 74 | $1,757,500 |
| 13 | 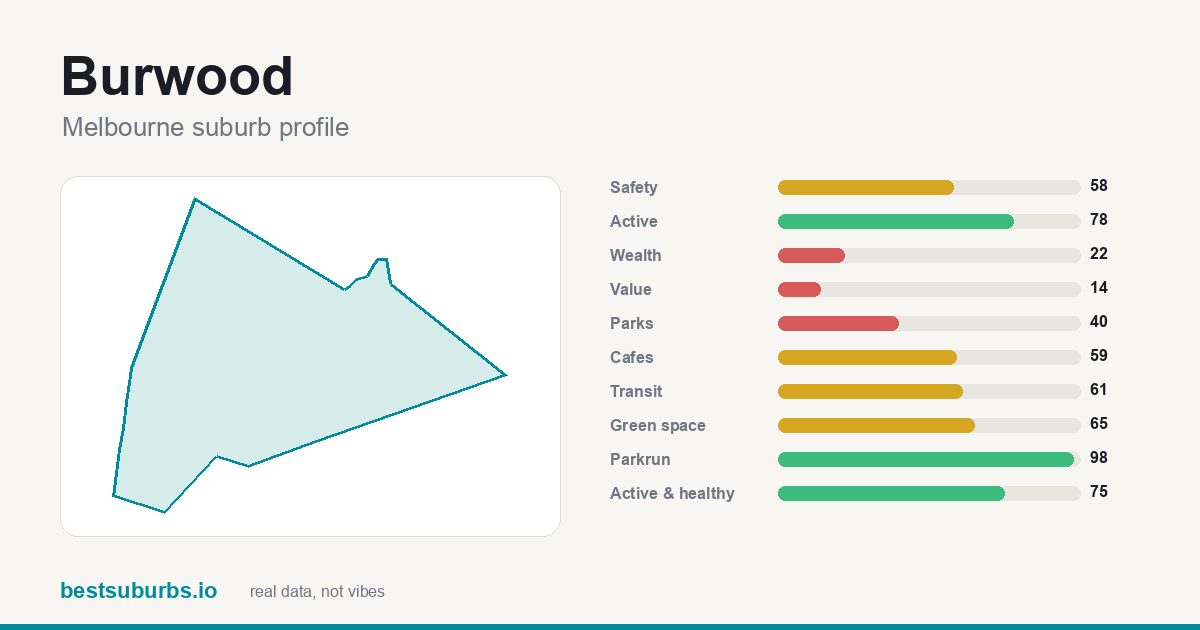 Burwood Burwood | — | 5.3 | 75 | $1,455,500 |
| 14 | 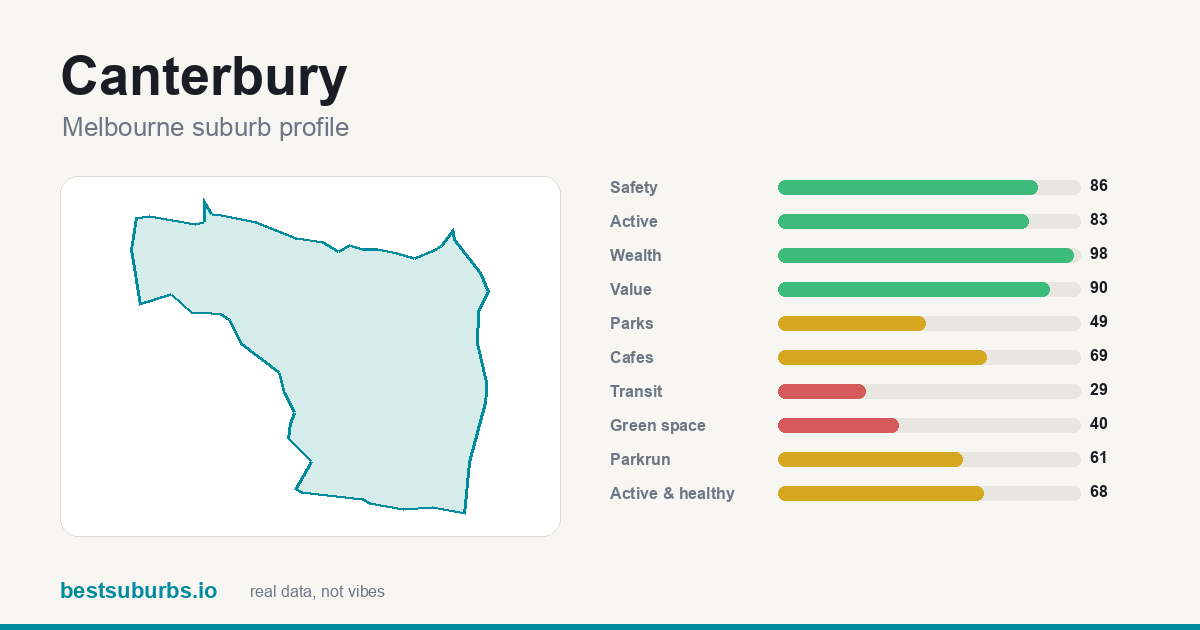 Canterbury Canterbury | — | 13.6 | 68 | $3,000,000 |
| 15 | 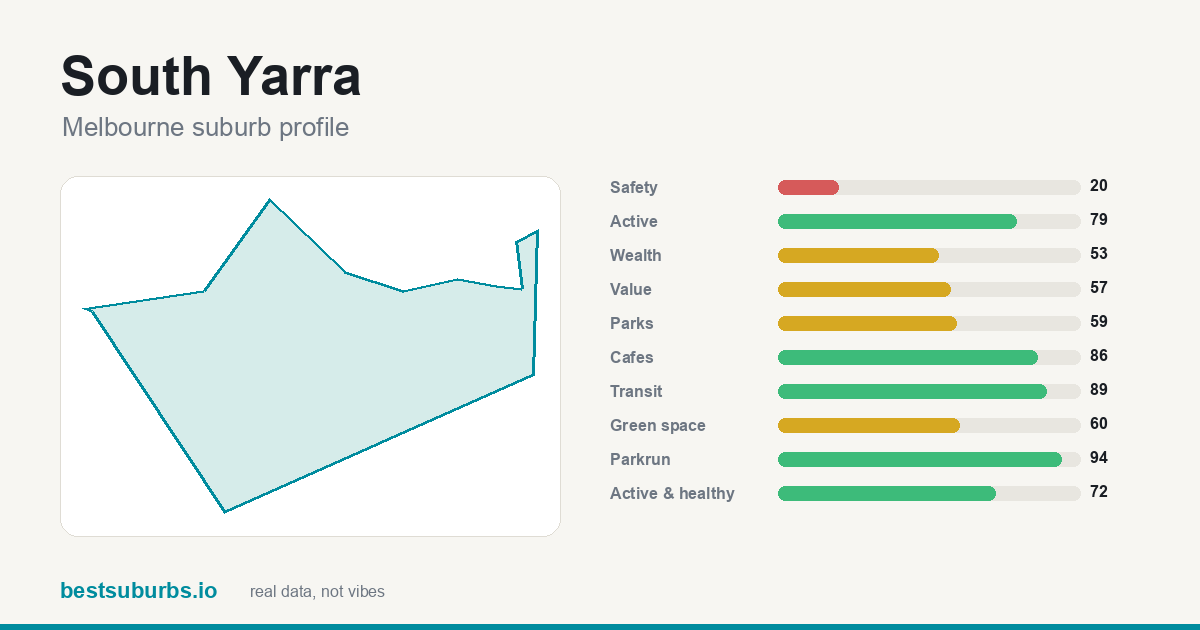 South Yarra South Yarra | — | 3.9 | 72 | $1,980,000 |
| 16 | 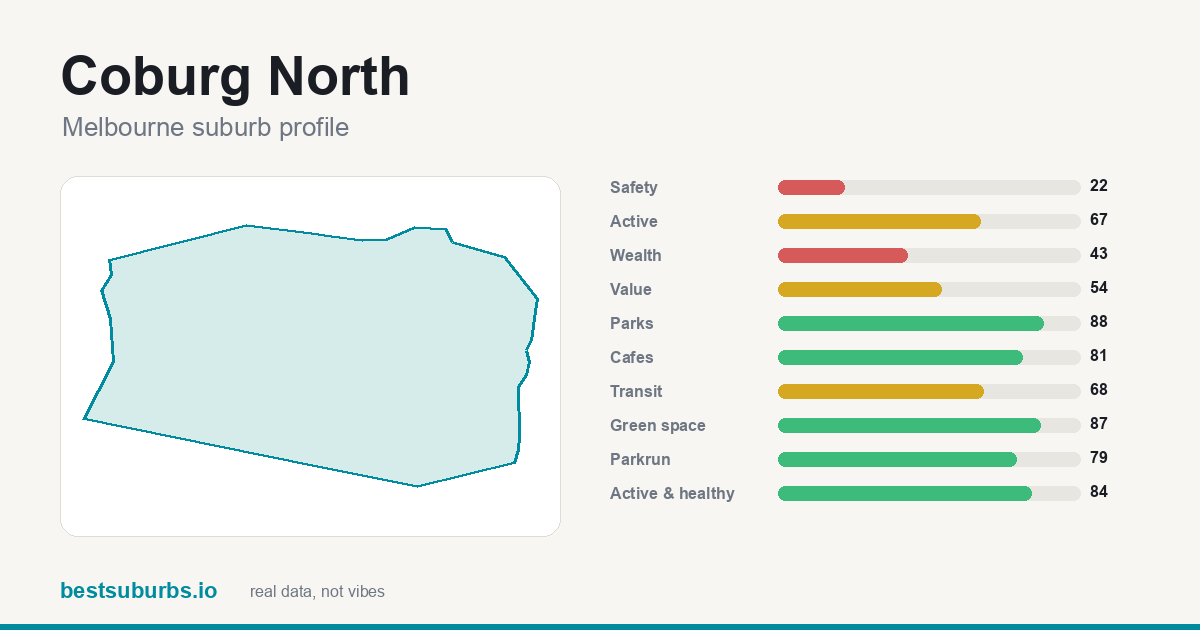 Coburg North Coburg North | — | 6.5 | 84 | $1,150,000 |
| 17 | 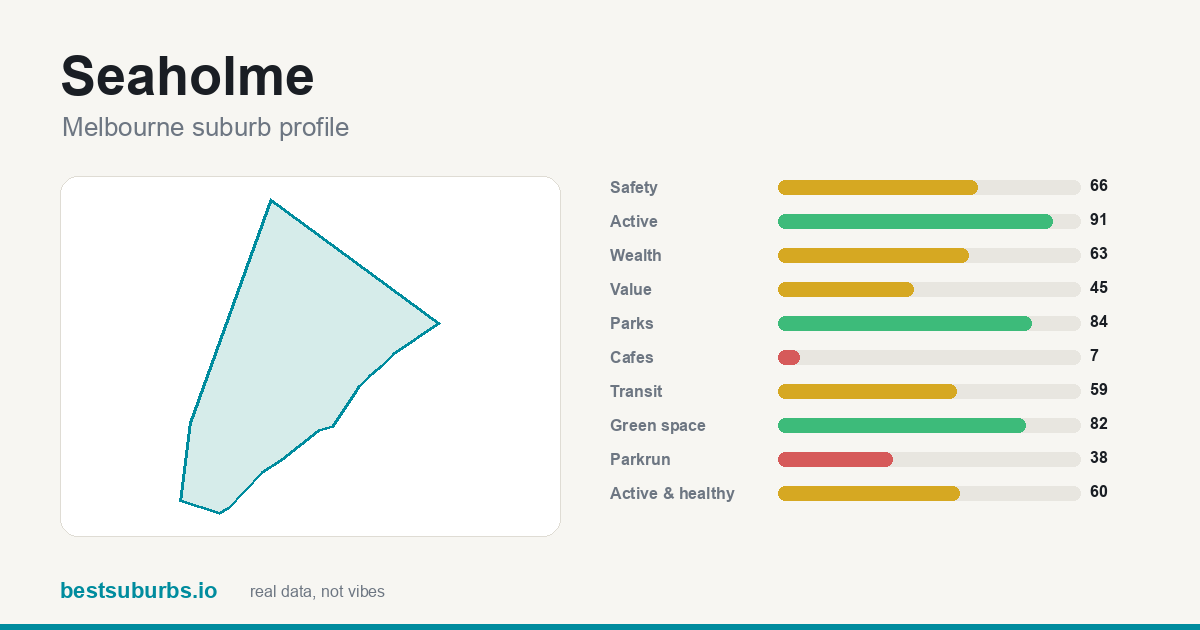 Seaholme Seaholme | — | 7.3 | 60 | $1,350,000 |
| 18 | 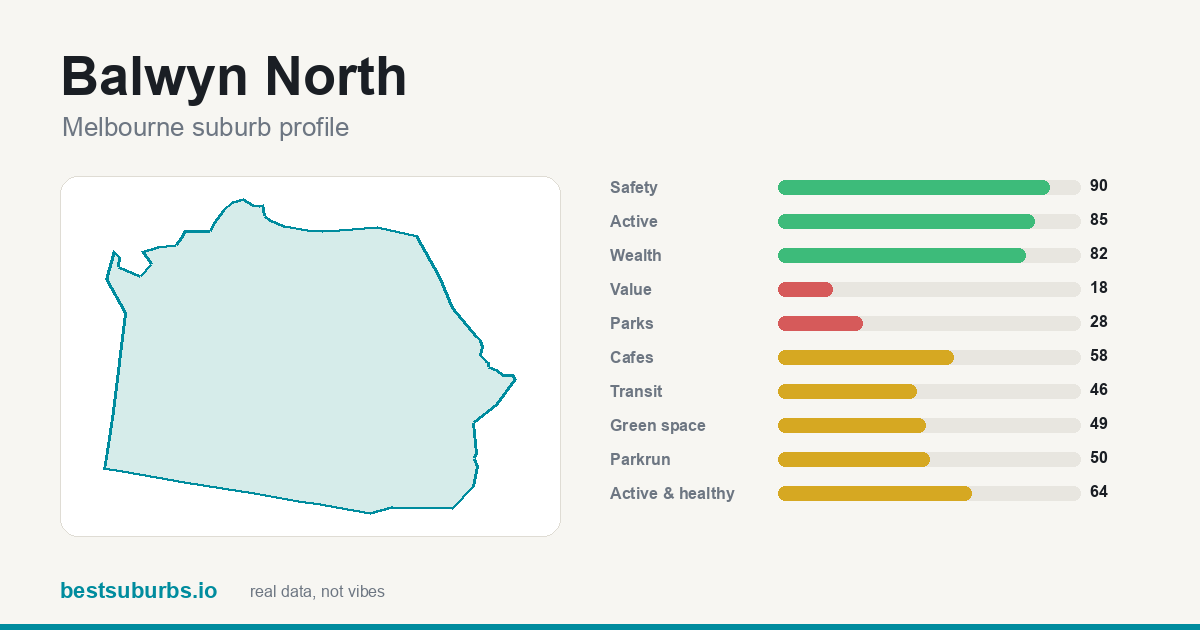 Balwyn North Balwyn North | — | 8.4 | 64 | $2,360,000 |
| 19 | 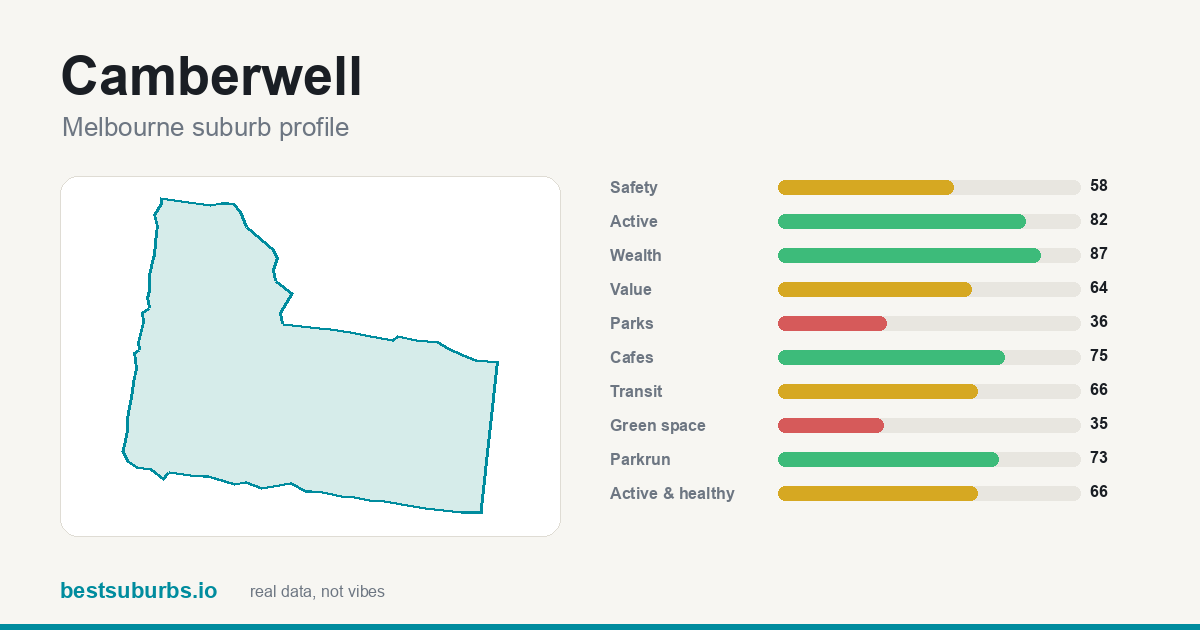 Camberwell Camberwell | — | 5.9 | 66 | $2,530,000 |
| 20 | 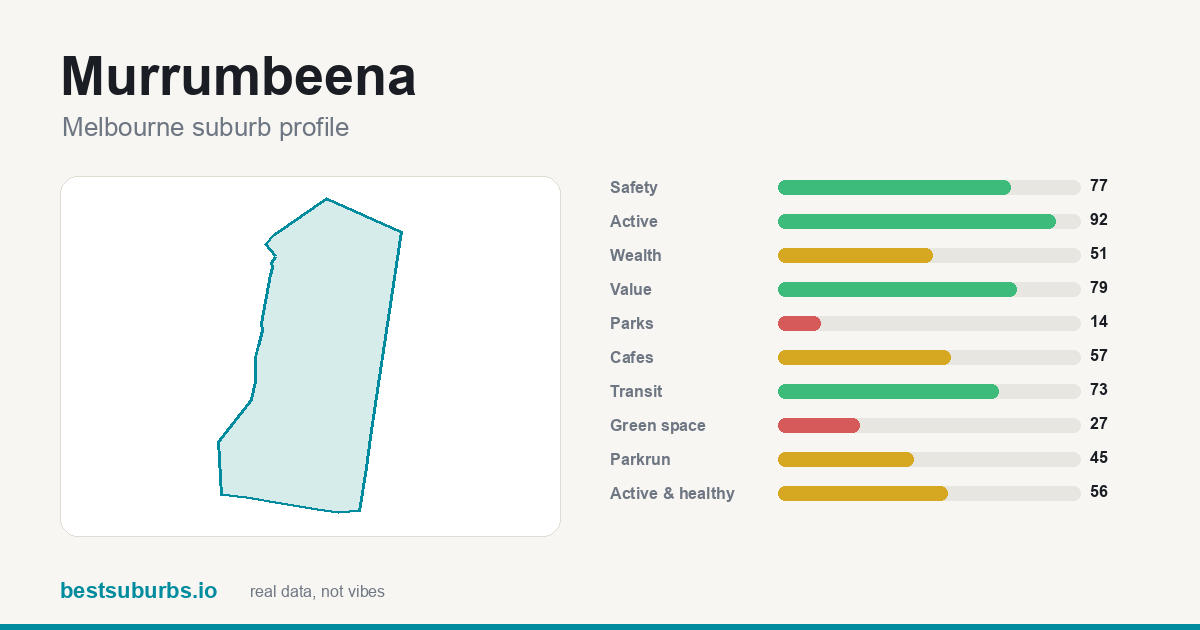 Murrumbeena Murrumbeena | — | 8.6 | 56 | $1,870,000 |
| 21 | 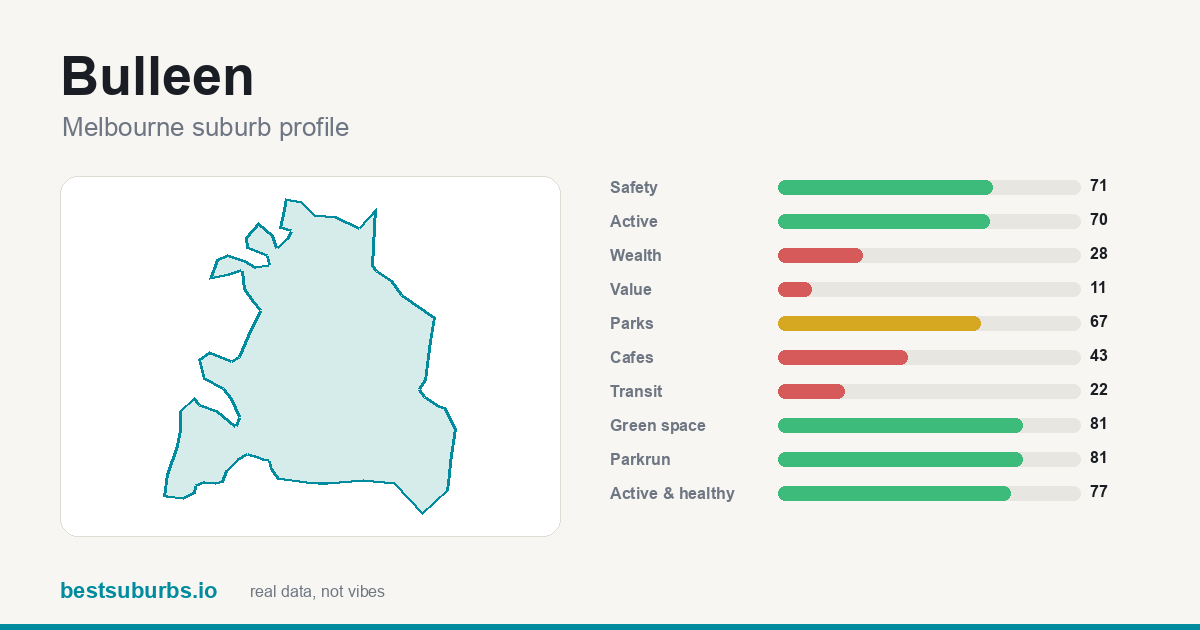 Bulleen Bulleen | — | 7.6 | 77 | $1,382,500 |
| 22 | 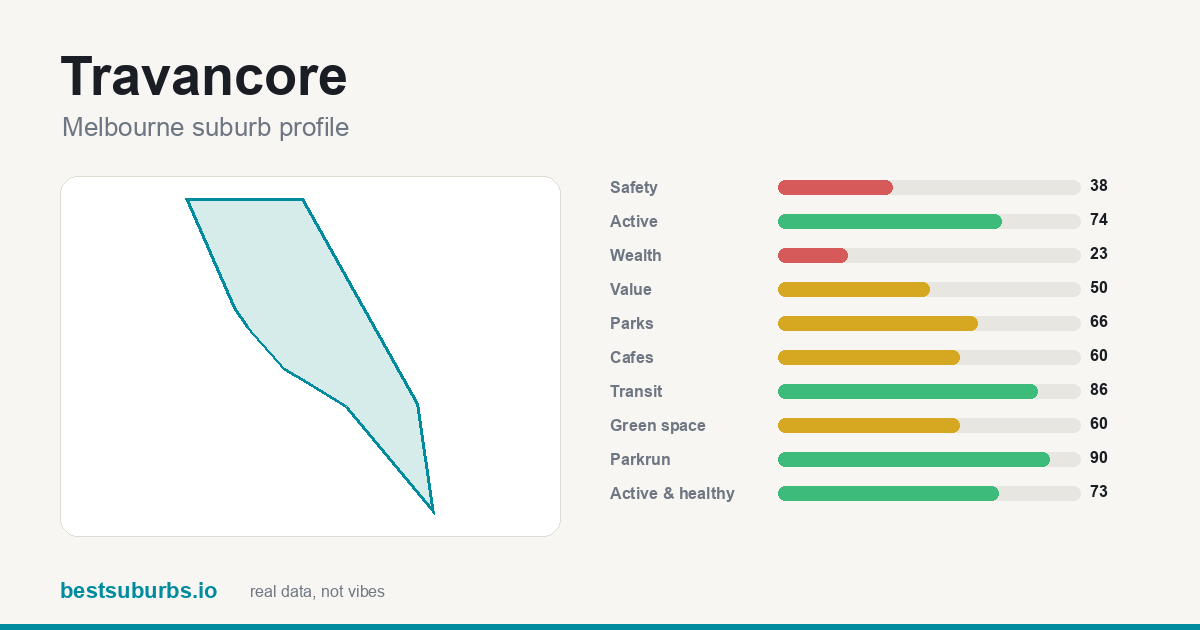 Travancore Travancore | — | 6.1 | 73 | — |
| 23 | 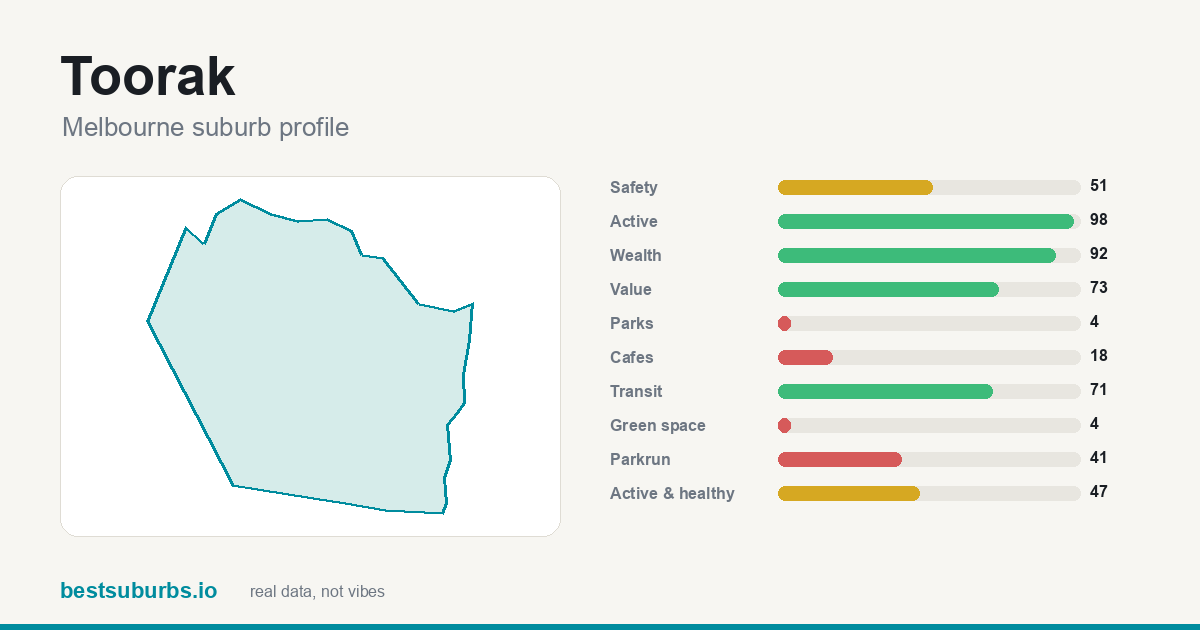 Toorak Toorak | — | 26.2 | 47 | $6,900,000 |
| 24 | 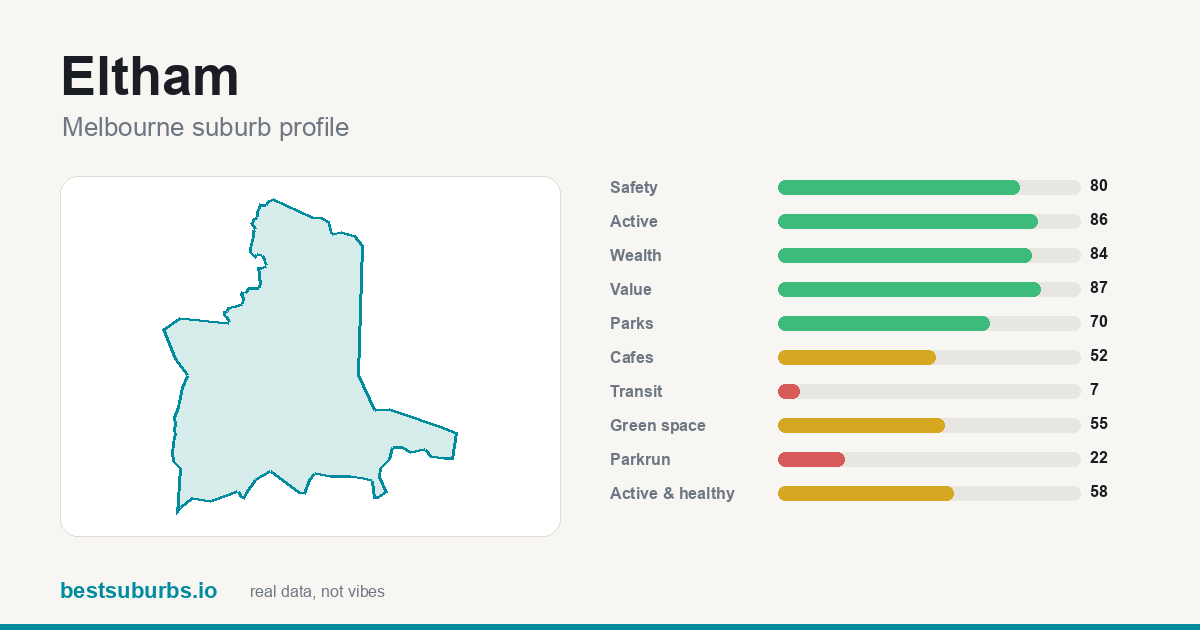 Eltham Eltham | — | 7.1 | 58 | $1,273,000 |
| 25 | 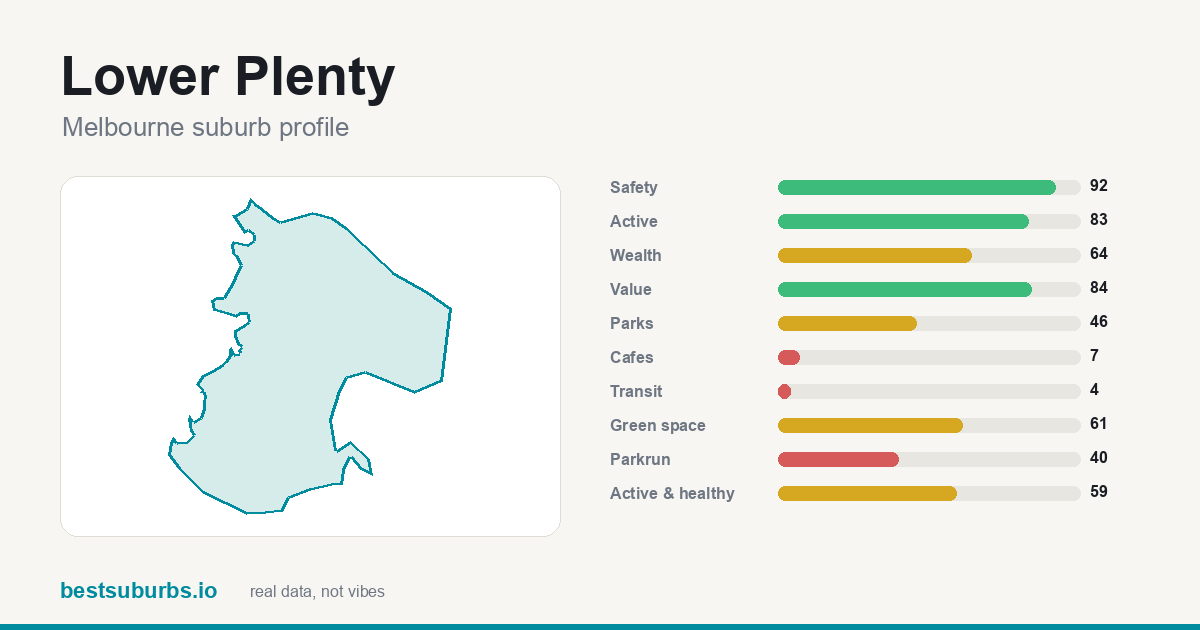 Lower Plenty Lower Plenty | — | 28.3 | 59 | $1,200,000 |
Showing the top 25 of 216 ranked suburbs. Scores are percentiles against every other suburb in Melbourne: 100 is the best in the city, 50 is mid-table. Click any suburb for its full profile.
Why are these the 10 most active suburbs in Melbourne? (October 2026)
Updated 14 October 2026 · one sentence of real reasons per suburb, from the data on this page.
- Albert Park ★ 90
#1 Albert Park — 86% of it within 400 m of a park, plus 2 government primary schools and 1 secondary inside the suburb, and 14 cafés.
- East Melbourne ★ 86
What lifts East Melbourne to #2 is 100% of it within 400 m of a park; it also has 72 public transport stops inside it for a transit score of 97, and 13.0 ha of parkland per 1,000 residents.
- Parkville ★ 86
Parkville takes #3 on 100% of it within 400 m of a park, with 28.5 ha of parkland per 1,000 residents, and 30 cafés.
- Eaglemont ★ 84
Eaglemont (#4) scores on a recorded crime rate of about 35 offences per 1,000 residents (safety score 80/100) and 86% of it within 400 m of a park, and 11.1 ha of parkland per 1,000 residents.
- Aberfeldie ★ 83
Aberfeldie (#5) scores on a recorded crime rate of about 39 offences per 1,000 residents (safety score 75/100) and 88% of it within 400 m of a park, and 2 government primary schools and 1 secondary inside the suburb.
- Heidelberg ★ 82
At #6, Heidelberg combines 92% of it within 400 m of a park and 2 government primary schools and 1 secondary inside the suburb, and 10 cafés.
- Kew ★ 80
Kew takes #7 on 9 government primary schools and 7 secondary inside the suburb, with 80% of it within 400 m of a park, and a recorded crime rate of about 55 offences per 1,000 residents (safety score 56/100).
- Hawthorn ★ 80
At #8, Hawthorn combines 6 government primary schools and 3 secondary inside the suburb and 82% of it within 400 m of a park, and 33 cafés.
- Brighton ★ 80
At #9, Brighton combines 7 government primary schools and 3 secondary inside the suburb and 82% of it within 400 m of a park, and a recorded crime rate of about 51 offences per 1,000 residents (safety score 60/100).
- Deepdene ★ 79
Deepdene ranks #10: 100% of it within 400 m of a park, a recorded crime rate of about 43 offences per 1,000 residents (safety score 69/100), and 2 government primary schools inside the suburb.
Why each of the top 10 healthiest, most active suburbs in Melbourne ranks where it does
Written from this page's own data: each figure below is the suburb's own value, set against the Melbourne median where we hold one.
1. Albert Park
Albert Park is #1 of 216 ranked Melbourne suburbs on this list, with a score of 90/100. It has an activity score of 89, a healthy score of 90 and 14.1 gyms and sports facilities per 1,000 residents. The trade-off: it scores 20/100 for safety, so it is weaker there. It covers 2.8 km² with about 6,044 residents (census).
2. East Melbourne
East Melbourne is #2 of 216 ranked Melbourne suburbs on this list, with a score of 86/100. It has an activity score of 89, a healthy score of 83 and 7.2 gyms and sports facilities per 1,000 residents. The trade-off: it scores 4/100 for safety, so it is weaker there. It covers 1.8 km² with about 4,896 residents (census).
3. Parkville
Parkville is #3 of 216 ranked Melbourne suburbs on this list, with a score of 86/100. It has an activity score of 76, a healthy score of 95 and 12.9 gyms and sports facilities per 1,000 residents. The trade-off: it scores 16/100 for safety, so it is weaker there. It covers 3.8 km² with about 7,074 residents (census).
4. Eaglemont
Eaglemont is #4 of 216 ranked Melbourne suburbs on this list, with a score of 84/100. It has an activity score of 92, a healthy score of 75 and 6.8 gyms and sports facilities per 1,000 residents. The trade-off: it scores 31/100 for public transport, so it is weaker there. It covers 2.2 km² with about 3,960 residents (census).
5. Aberfeldie
Aberfeldie is #5 of 216 ranked Melbourne suburbs on this list, with a score of 83/100. It has an activity score of 86, a healthy score of 80 and 17.1 gyms and sports facilities per 1,000 residents. The trade-off: it scores 17/100 for public transport, so it is weaker there. It covers 1.5 km² with about 3,925 residents (census).
6. Heidelberg
Heidelberg is #6 of 216 ranked Melbourne suburbs on this list, with a score of 82/100. It has an activity score of 84, a healthy score of 81 and 5.4 gyms and sports facilities per 1,000 residents. The trade-off: it scores 3/100 for safety, so it is weaker there. It covers 2.9 km² with about 7,360 residents (census).
7. Kew
Kew is #7 of 216 ranked Melbourne suburbs on this list, with a score of 80/100. It has an activity score of 92, a healthy score of 69 and 9.1 gyms and sports facilities per 1,000 residents. The trade-off: it scores 34/100 for public transport, so it is weaker there. It covers 10.4 km² with about 24,499 residents (census).
8. Hawthorn
Hawthorn is #8 of 216 ranked Melbourne suburbs on this list, with a score of 80/100. It has an activity score of 92, a healthy score of 68 and 11.8 gyms and sports facilities per 1,000 residents. The trade-off: it scores 36/100 for safety, so it is weaker there. It covers 5.9 km² with about 22,322 residents (census).
9. Brighton
Brighton is #9 of 216 ranked Melbourne suburbs on this list, with a score of 80/100. It has an activity score of 96, a healthy score of 63 and 12.3 gyms and sports facilities per 1,000 residents. The trade-off: it scores 28/100 for parks, so it is weaker there. It covers 8.6 km² with about 23,252 residents (census).
10. Deepdene
Deepdene is #10 of 216 ranked Melbourne suburbs on this list, with a score of 79/100. It has an activity score of 87, a healthy score of 71 and 14.8 gyms and sports facilities per 1,000 residents. The trade-off: it scores 29/100 for value for rent, so it is weaker there. It covers 0.8 km² with about 2,101 residents (census).
How do these suburbs compare head to head?
What else do people ask about healthiest, most active suburbs in Melbourne?
What are the healthiest, most active suburbs in Melbourne?
On our October 2026 data the top five are Albert Park (90/100), East Melbourne (86/100), Parkville (86/100), Eaglemont (84/100), Aberfeldie (83/100), out of 216 ranked Melbourne suburbs.
How is this ranking calculated?
GPS activity heat per square kilometre from open activity traces, blended with the healthy score (gyms, sports facilities and parks per resident). This is the dataset nobody else in the category publishes. 216 of 216 Melbourne suburbs had enough data to be ranked. Updated October 2026.
Is this ranking sponsored?
No. No ranking on this site is sold or sponsored. It is computed from open data: GPS activity traces, official crime statistics, the ABS census and OpenStreetMap.
What other Melbourne rankings are there?
Sources: open GPS activity traces, official crime statistics, ABS census,
OpenStreetMap (ODbL). Sale prices: Victorian Property Sales Report, October–December 2025 quarter — © State of Victoria (Department of Transport and Planning / Valuer-General Victoria), Victorian Property Sales Report, CC BY 4.0. Quarterly median of sales settled in the quarter, per suburb. Figures marked as low-volume rest on fewer than 10 sales that quarter. No ranking on this site is sold or sponsored.
← all 216 Melbourne suburbs, with sliders