Best value suburbs in Melbourne
What each suburb offers against what it costs to live there.
Yallambie (98/100), Attwood (94/100), Diamond Creek (93/100) lead this ranking of 215 Melbourne suburbs.
By BestSuburbs research · Updated October 2026
Part of Melbourne suburb rankings · all Melbourne lists
Which Melbourne suburbs are the best value?
How do the top 25 compare, measure by measure?
| # | Suburb | Median rent ($/wk) | Value score | Median house price |
|---|---|---|---|---|
| 1 | 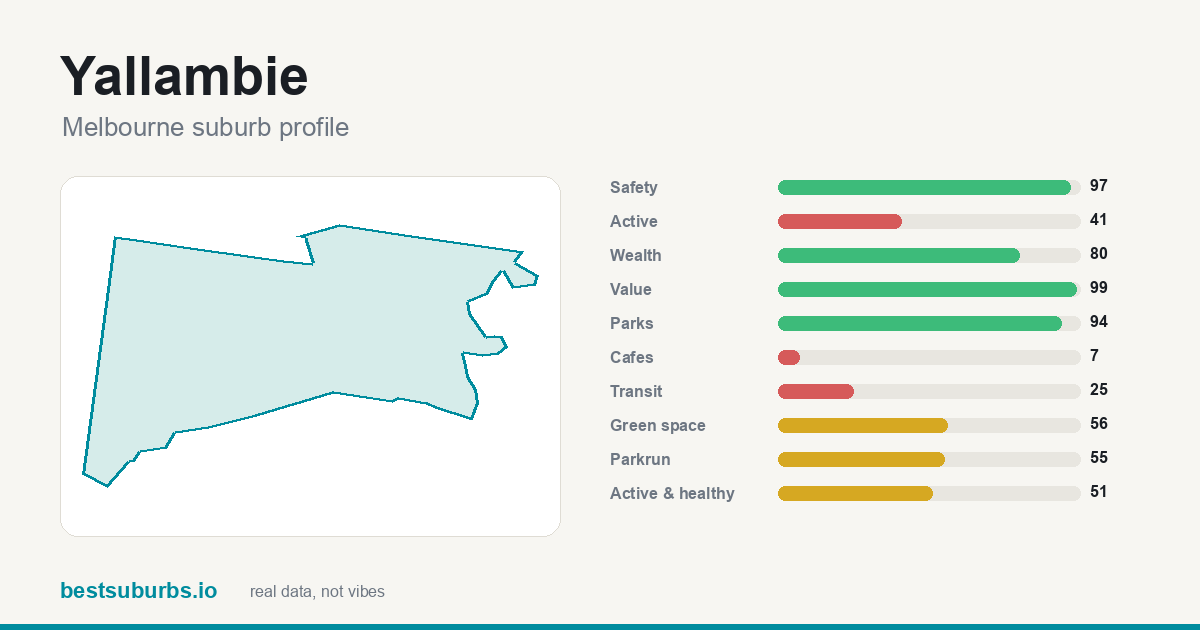 Yallambie Yallambie | 340 | 99 | $1,026,800 |
| 2 | 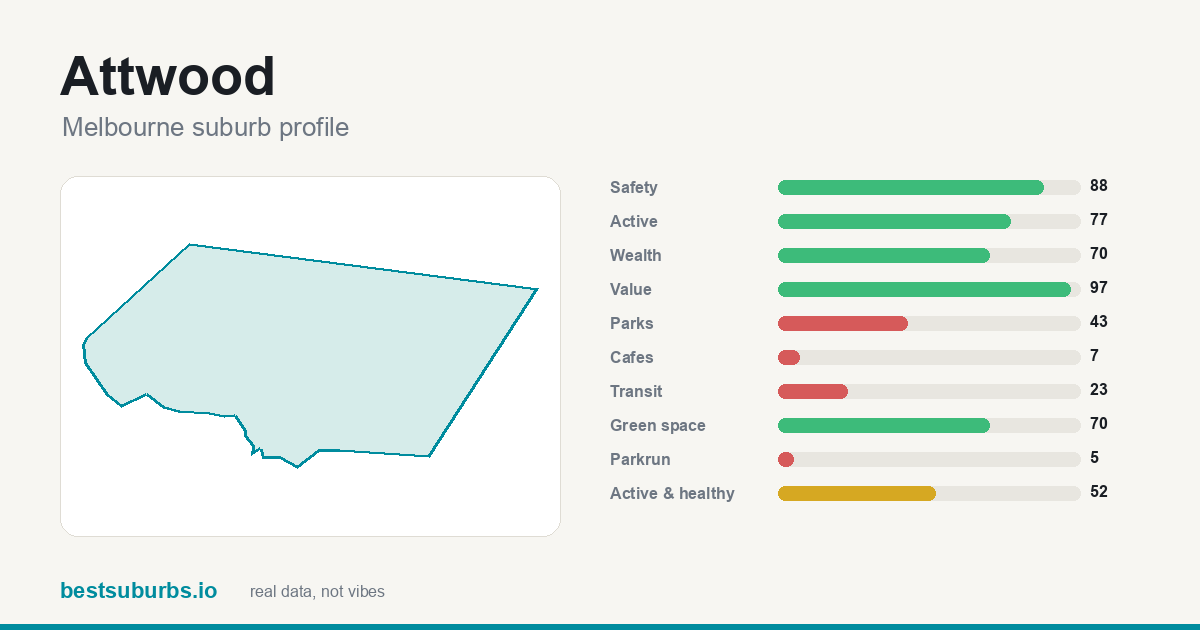 Attwood Attwood | 358 | 97 | $895,000 |
| 3 | 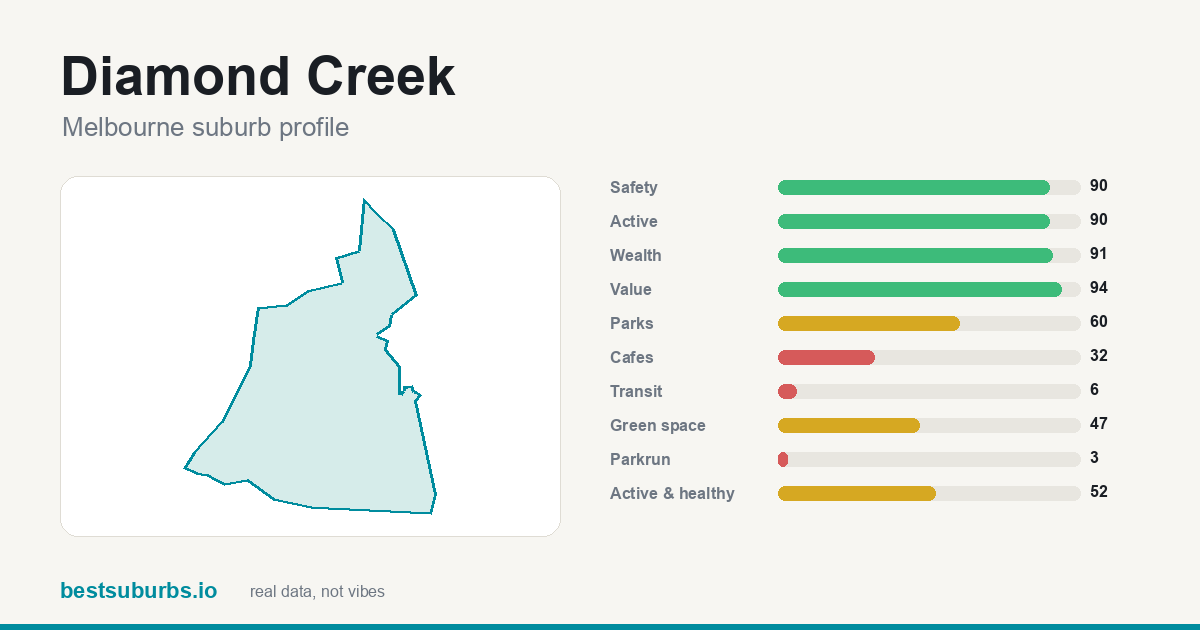 Diamond Creek Diamond Creek | 430 | 94 | $1,060,000 |
| 4 | 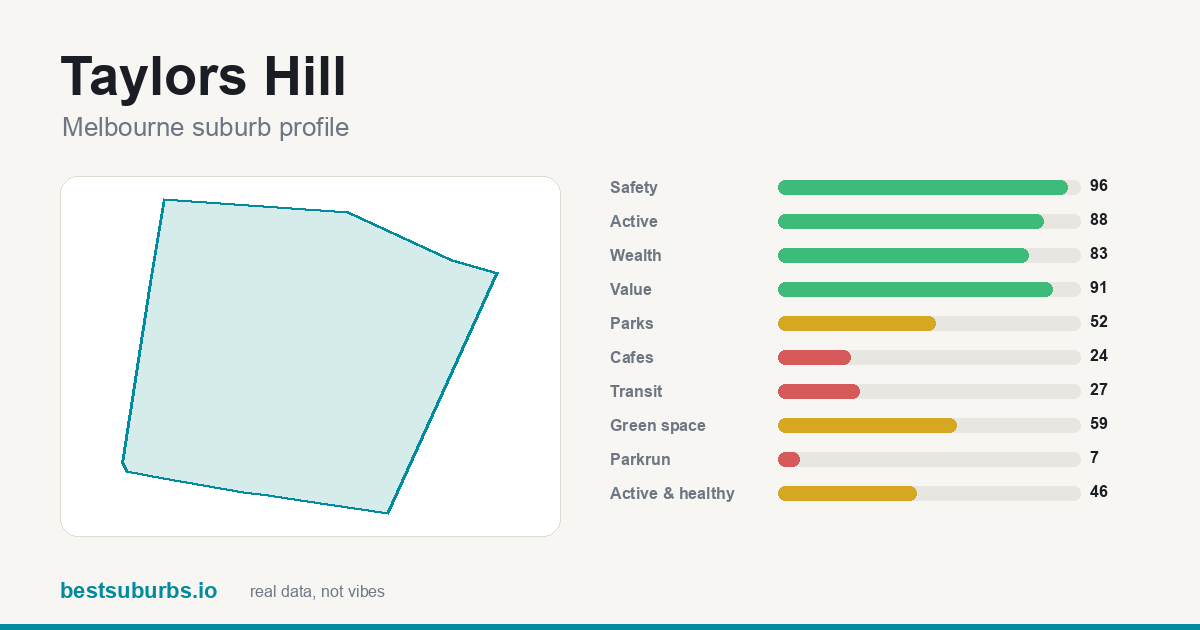 Taylors Hill Taylors Hill | 420 | 91 | $938,000 |
| 5 | 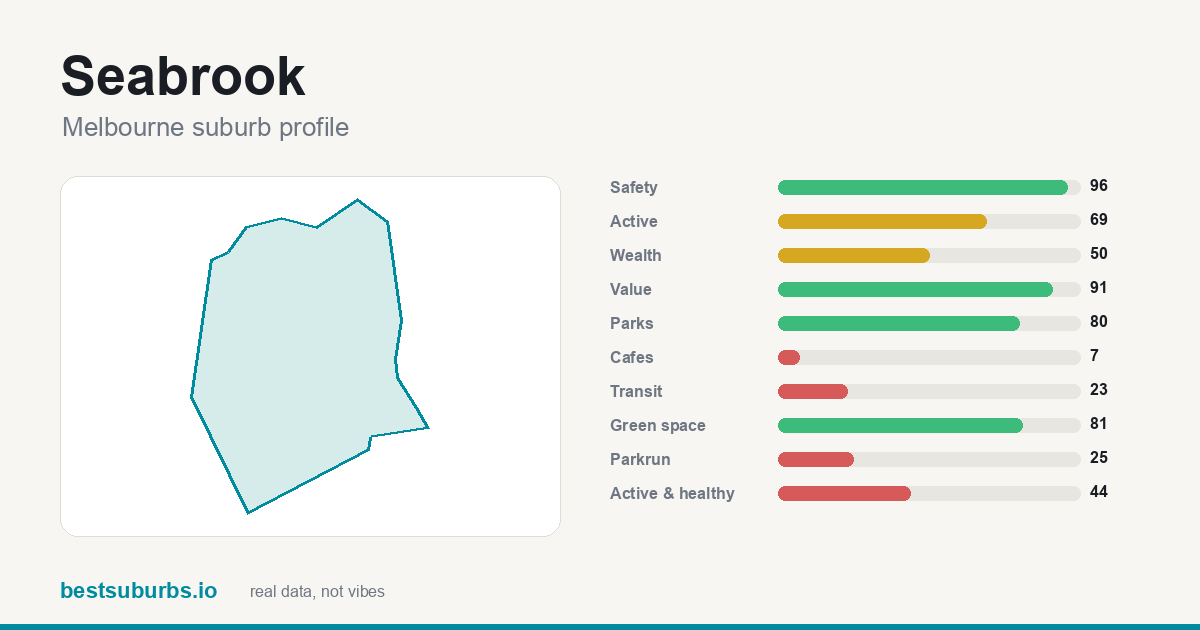 Seabrook Seabrook | 361 | 91 | $811,000 |
| 6 | 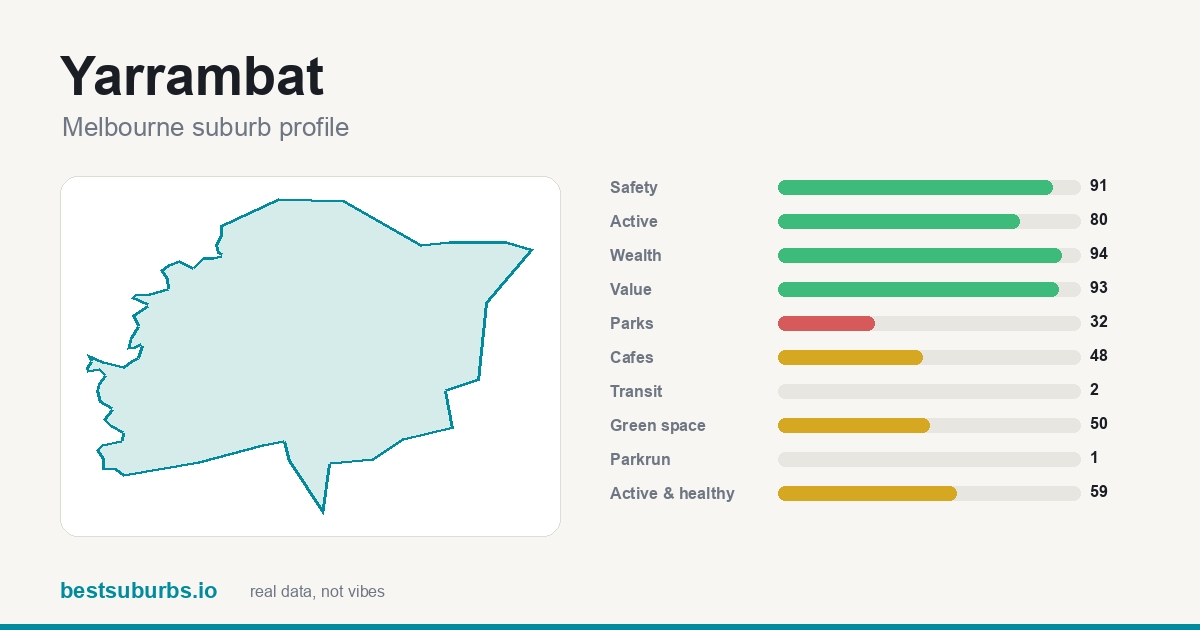 Yarrambat Yarrambat | 450 | 93 | — |
| 7 | 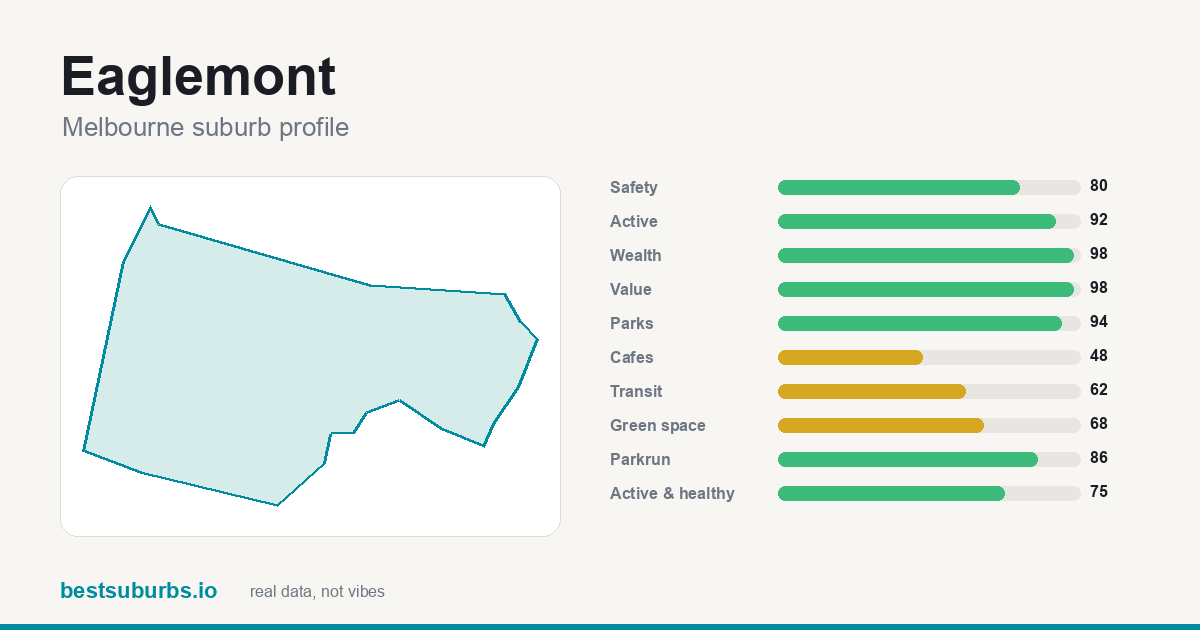 Eaglemont Eaglemont | 453 | 98 | $2,581,000 |
| 8 | 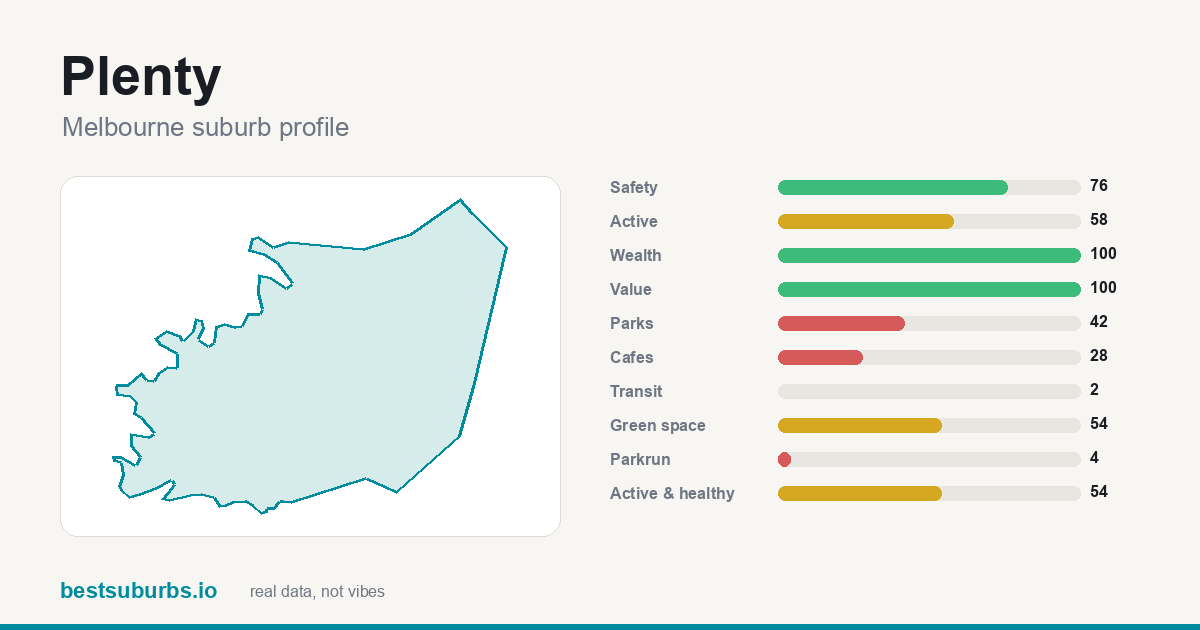 Plenty Plenty | 392 | 100 | $1,630,000 |
| 9 | 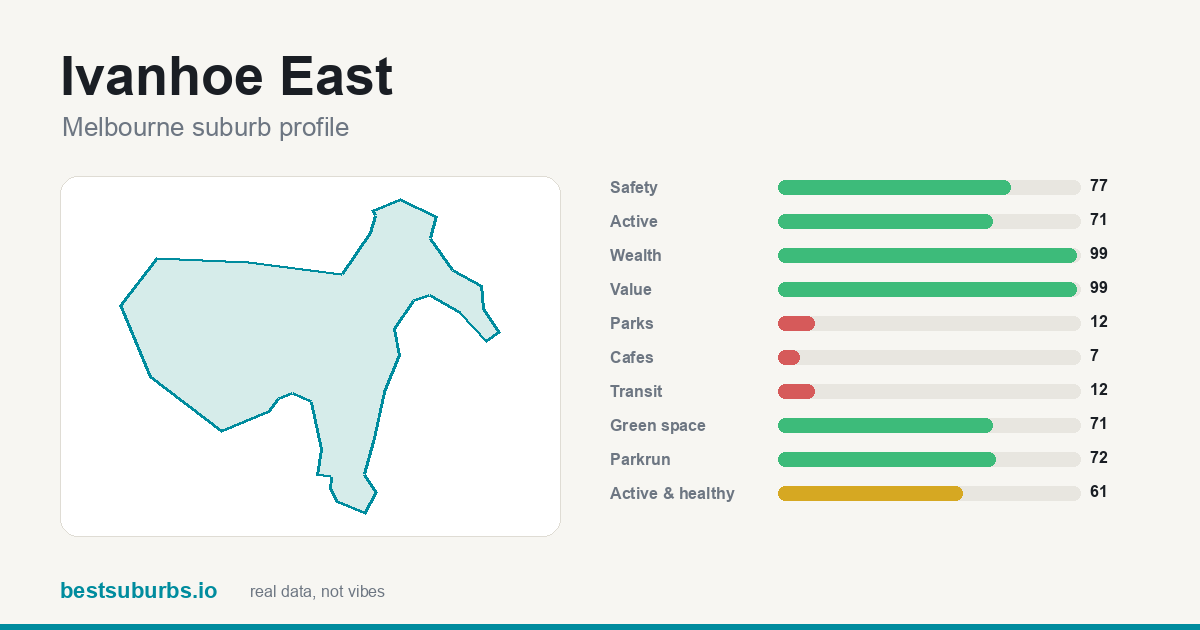 Ivanhoe East Ivanhoe East | 451 | 99 | $2,300,000 |
| 10 | 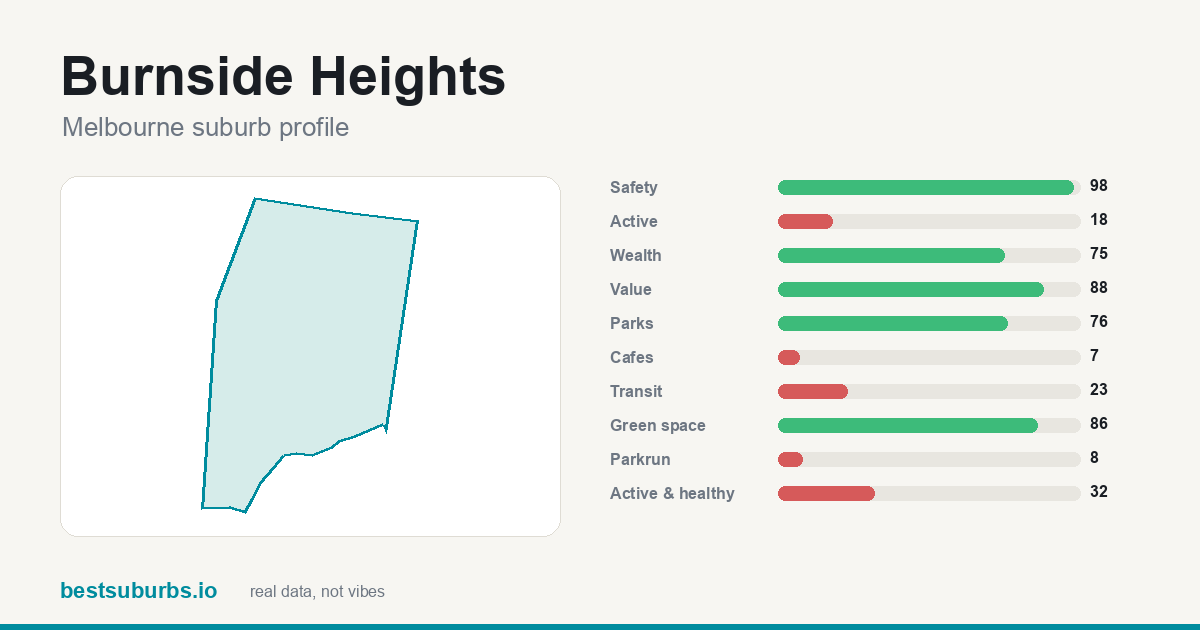 Burnside Heights Burnside Heights | 411 | 88 | $770,000 |
| 11 | 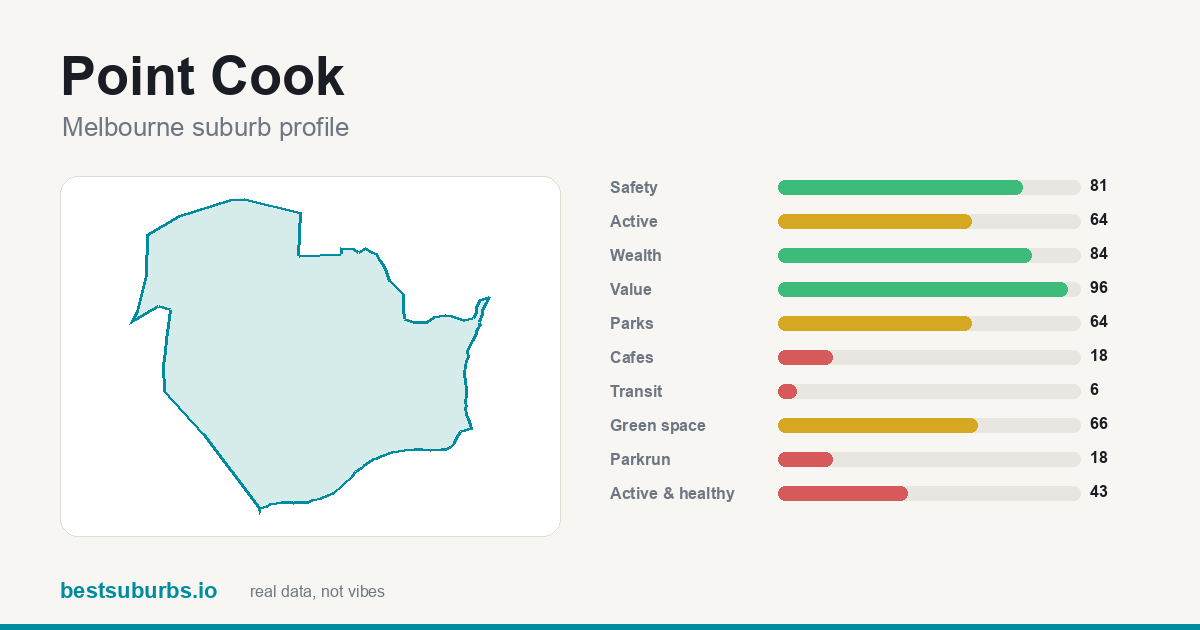 Point Cook Point Cook | 400 | 96 | $842,000 |
| 12 | 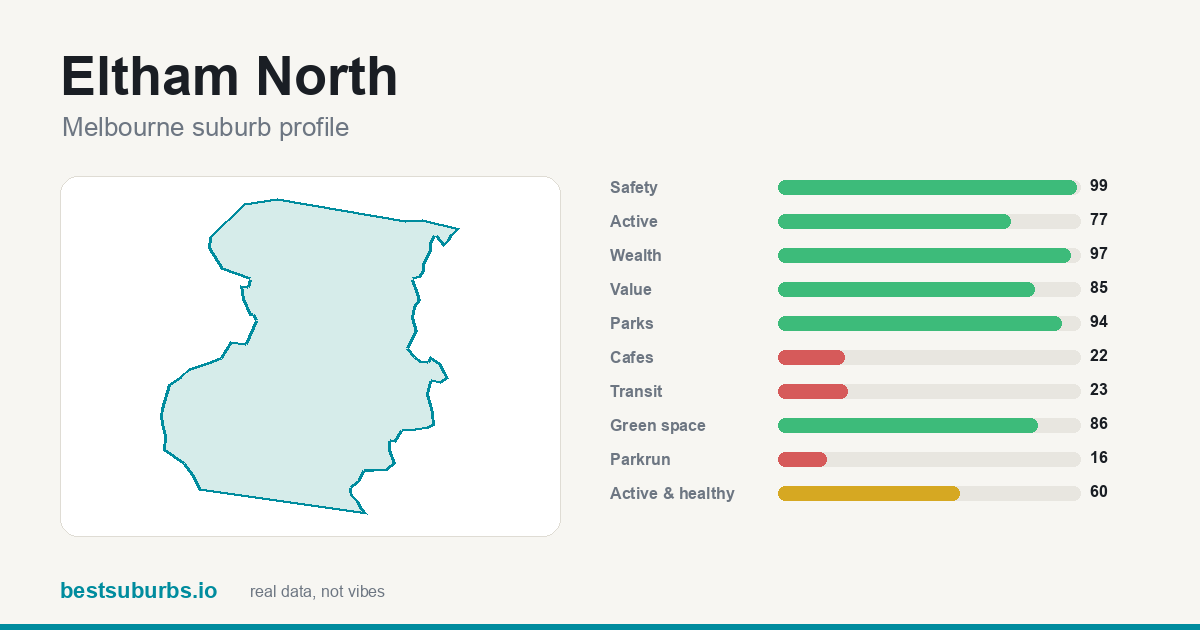 Eltham North Eltham North | 512 | 85 | $1,218,900 |
| 13 | 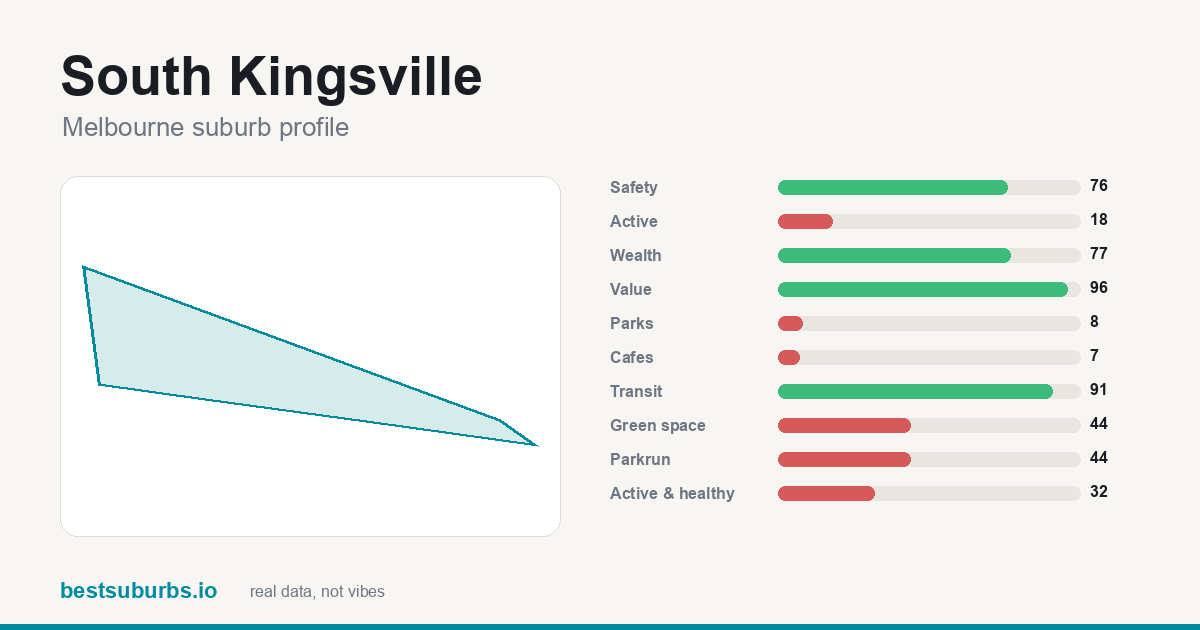 South Kingsville South Kingsville | 381 | 96 | $1,660,000 |
| 14 | 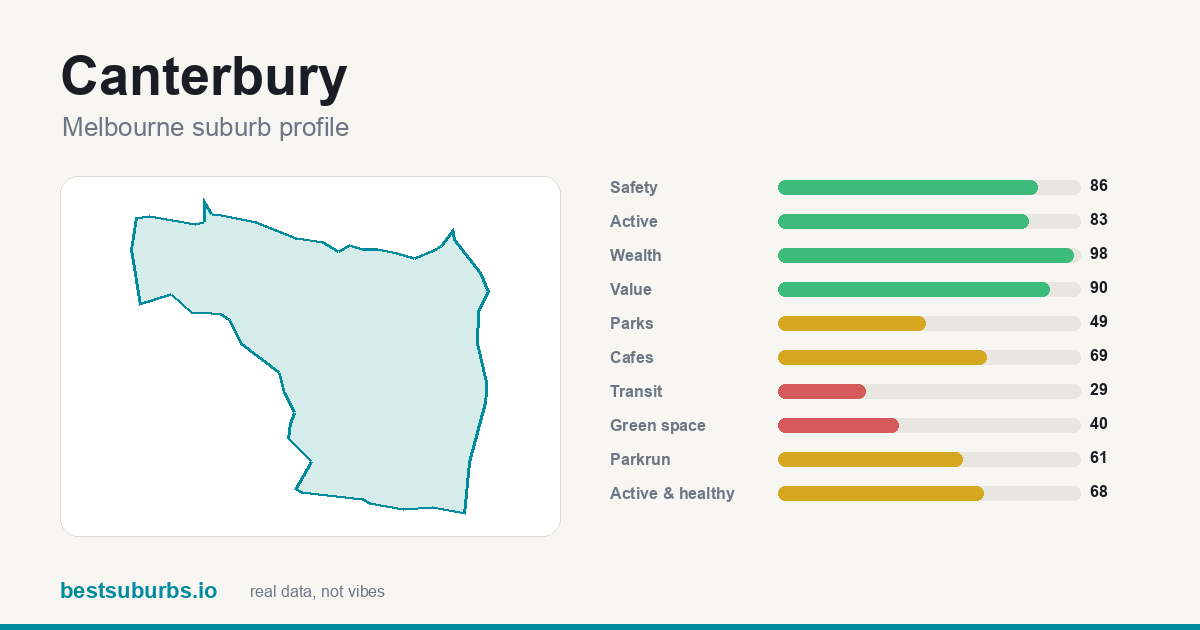 Canterbury Canterbury | 515 | 90 | $3,000,000 |
| 15 | 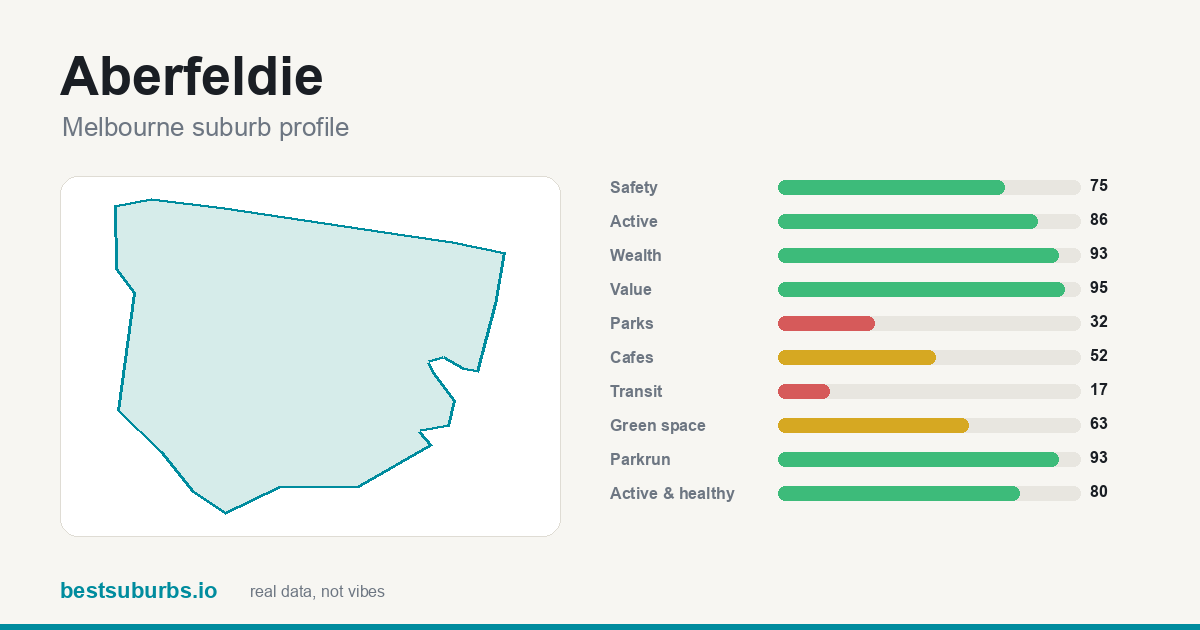 Aberfeldie Aberfeldie | 440 | 95 | $1,845,000 |
| 16 | 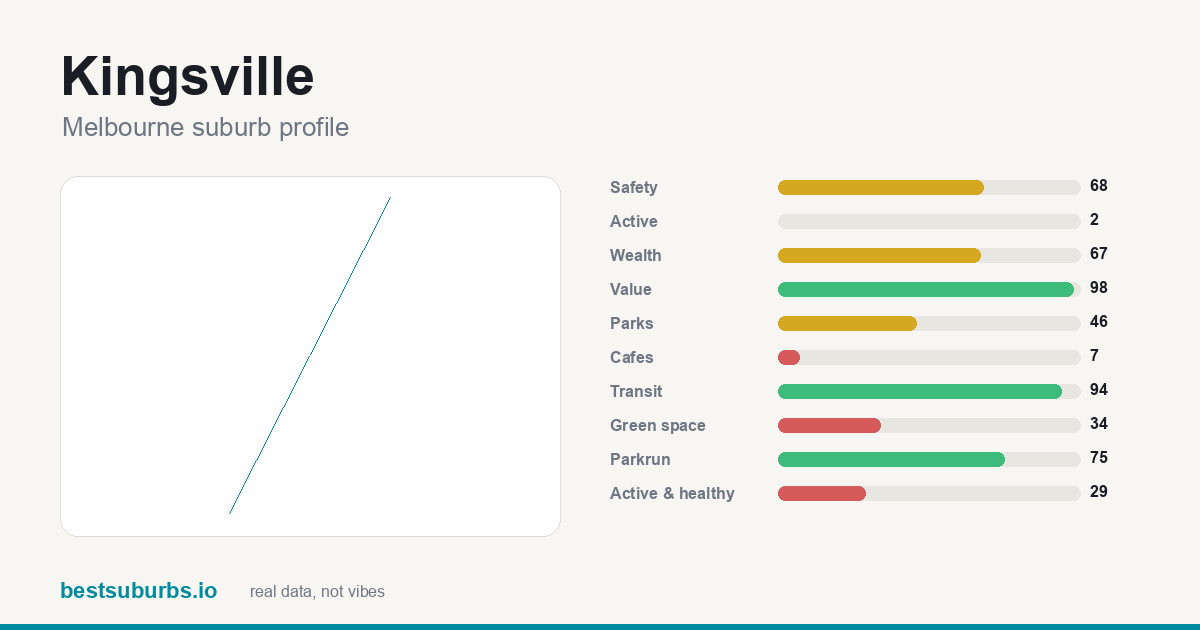 Kingsville Kingsville | 355 | 98 | $1,098,800 |
| 17 | 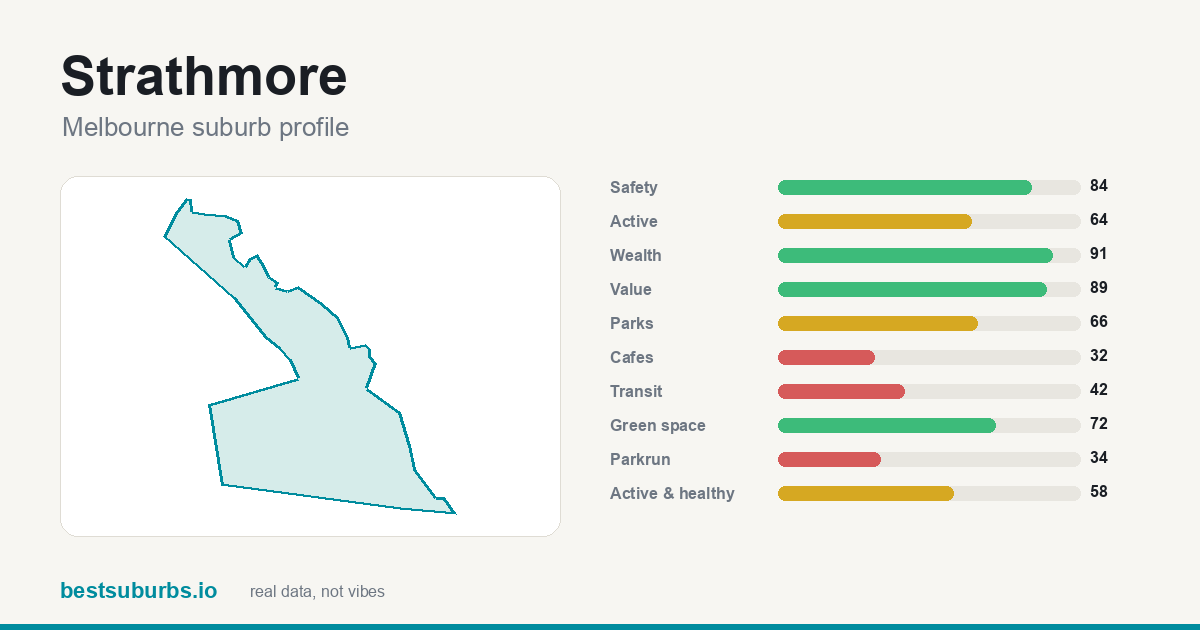 Strathmore Strathmore | 450 | 89 | $1,450,000 |
| 18 | 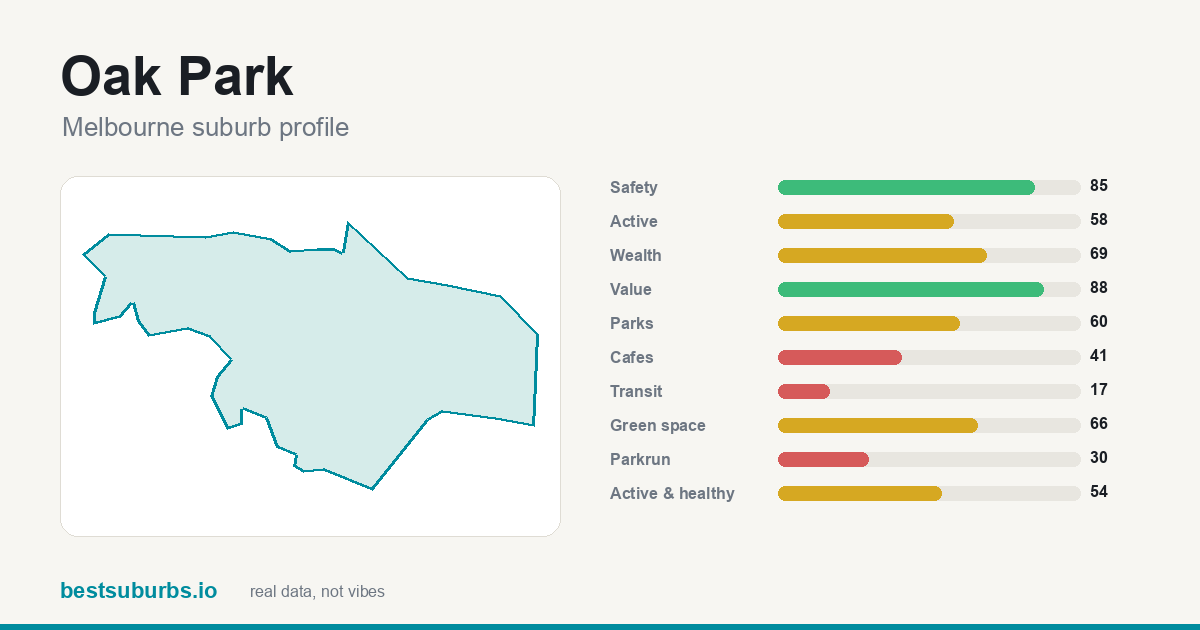 Oak Park Oak Park | 401 | 88 | $1,120,000 |
| 19 | 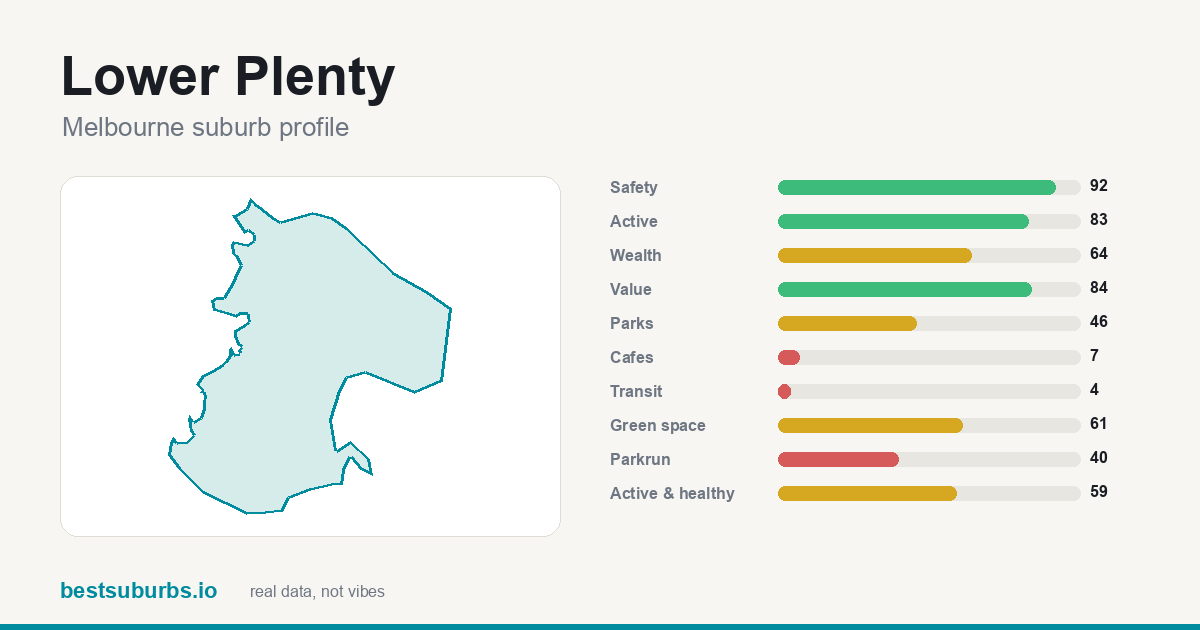 Lower Plenty Lower Plenty | 400 | 84 | $1,200,000 |
| 20 | 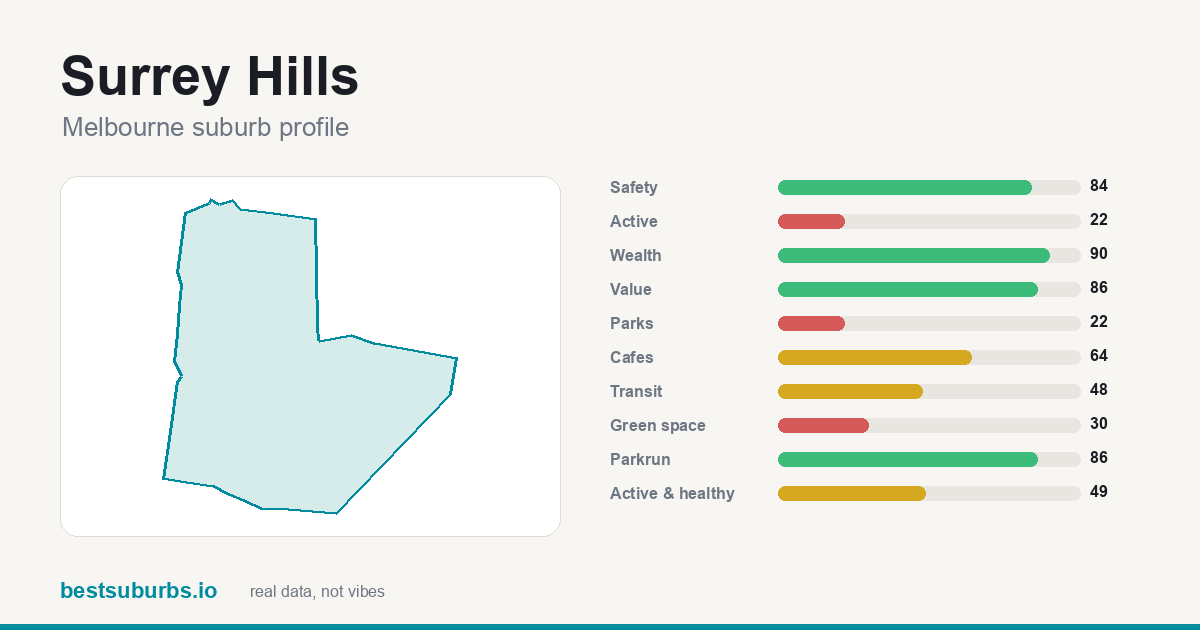 Surrey Hills Surrey Hills | 462 | 86 | $2,200,000 |
| 21 | 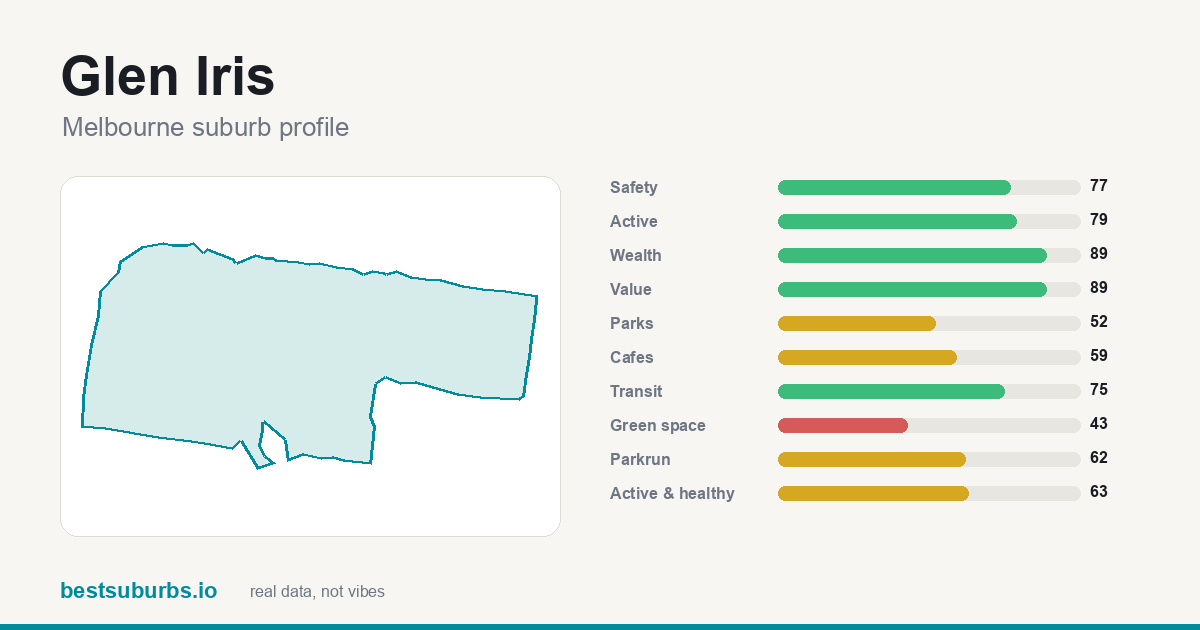 Glen Iris Glen Iris | 450 | 89 | $2,685,000 |
| 22 | 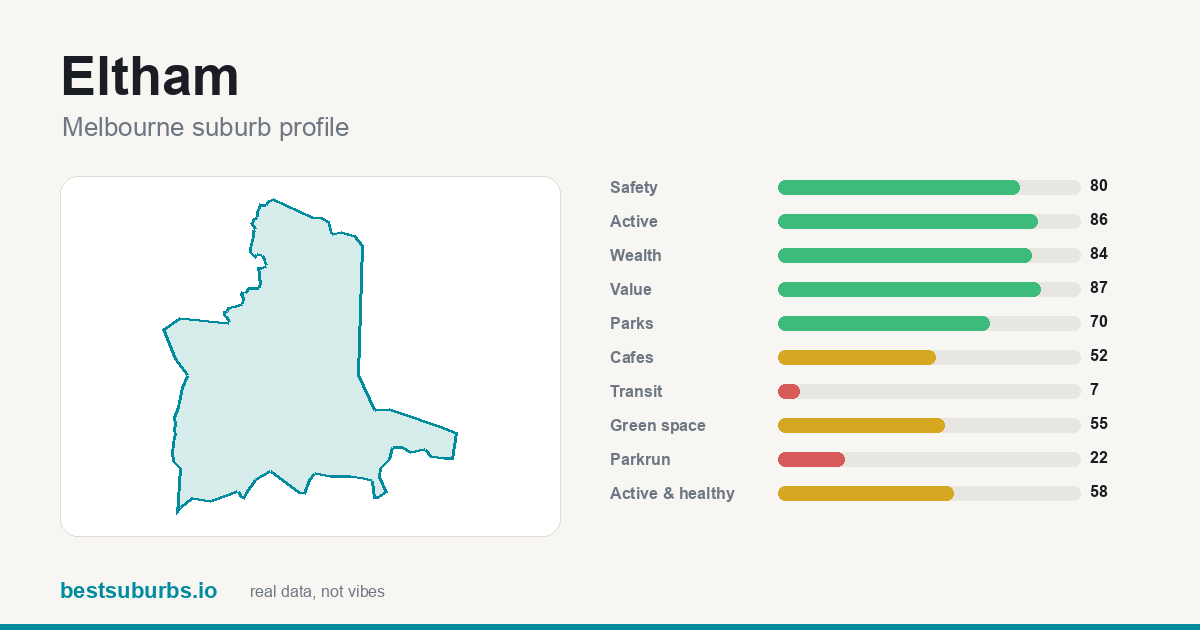 Eltham Eltham | 440 | 87 | $1,273,000 |
| 23 | 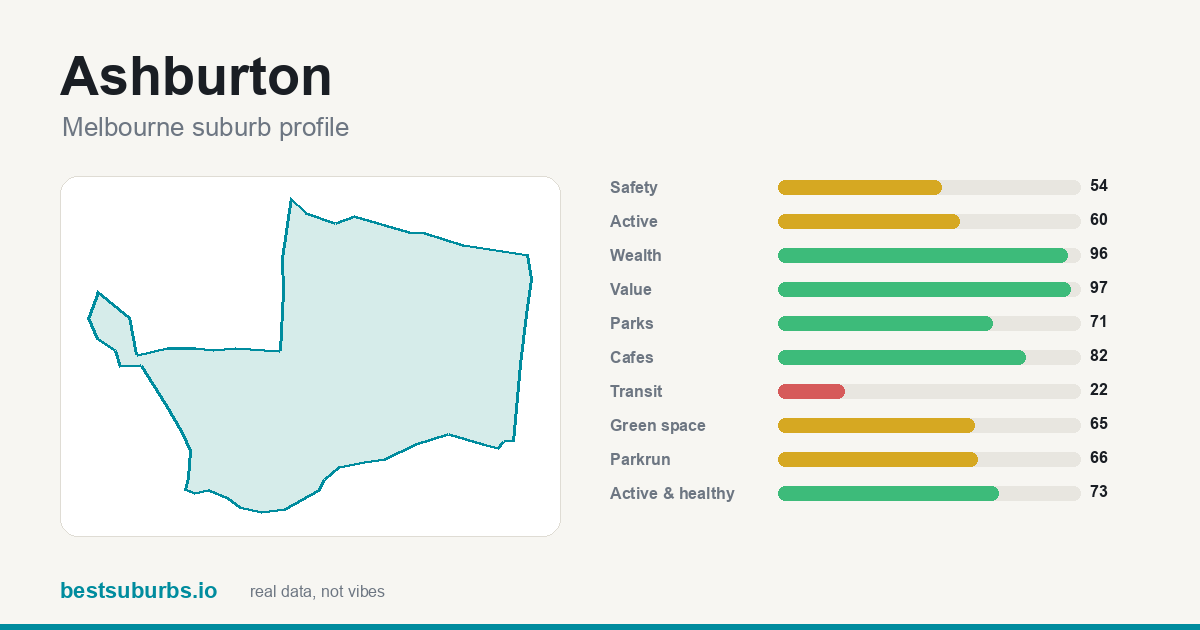 Ashburton Ashburton | 455 | 97 | $1,990,500 |
| 24 | 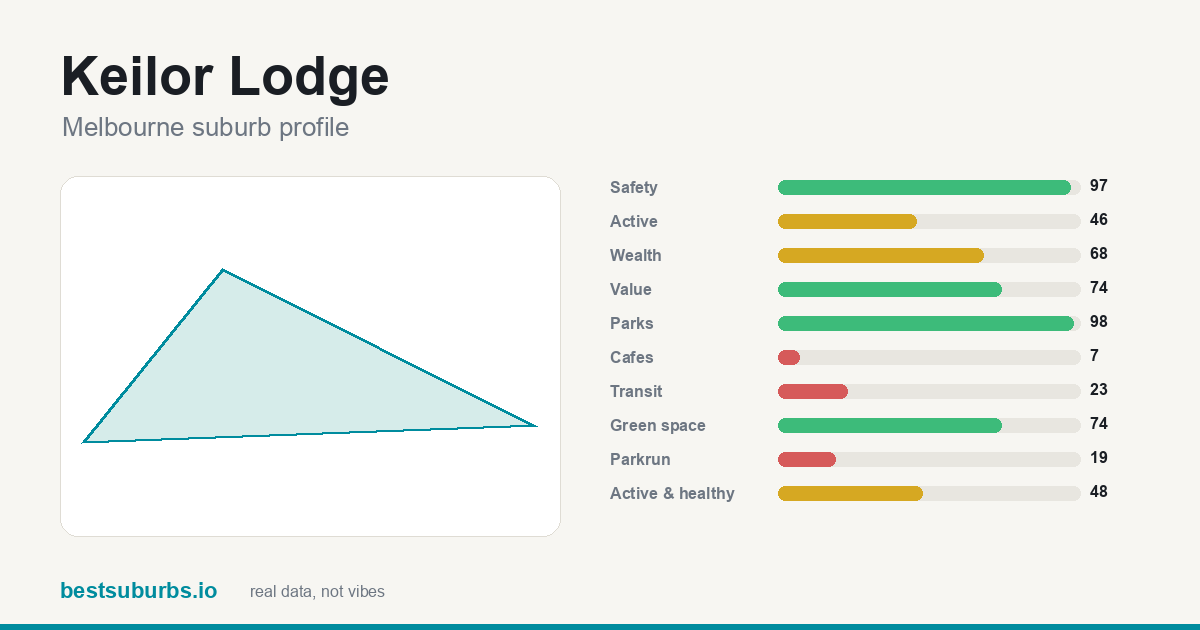 Keilor Lodge Keilor Lodge | 421 | 74 | $1,090,500 |
| 25 | 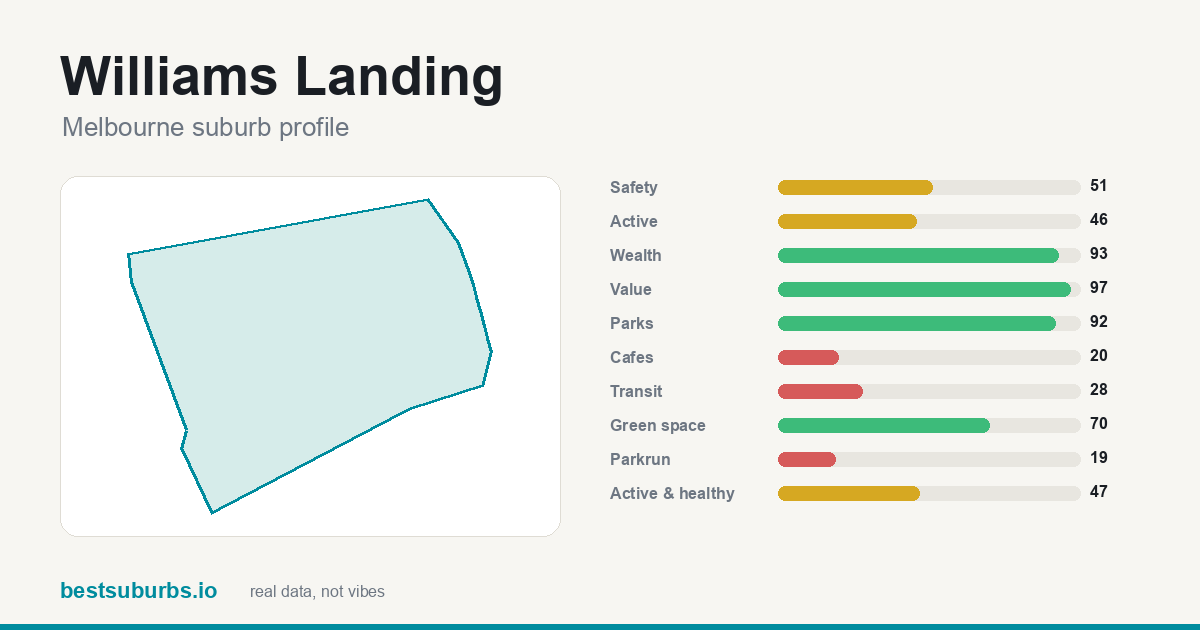 Williams Landing Williams Landing | 420 | 97 | $840,000 |
Showing the top 25 of 215 ranked suburbs. Scores are percentiles against every other suburb in Melbourne: 100 is the best in the city, 50 is mid-table. Click any suburb for its full profile.
What are the cheapest and most affordable suburbs in Melbourne?
Best value is not the same as cheapest: this list weighs what a suburb offers against its rent. By median weekly rent alone, the cheapest Melbourne suburbs with at least 2,000 residents are Flemington ($300/wk), Albion ($301/wk), Heidelberg West ($306/wk), Braybrook ($312/wk), Campbellfield ($320/wk). Measured as rent against local household income, the most affordable are Plenty (12%), Yallambie (15%), Ivanhoe East (15%). Figures are ABS Census 2021 medians, so today's rents are higher.
Full lists: cheapest suburbs to rent in Melbourne · most affordable suburbs in Melbourne (rent vs income)
Why are these the 10 best-value suburbs in Melbourne? (October 2026)
Updated 14 October 2026 · one sentence of real reasons per suburb, from the data on this page.
- Yallambie ★ 98
At #1, Yallambie combines a recorded crime rate of about 20 offences per 1,000 residents (safety score 97/100) and 80% of it within 400 m of a park, and 1 government primary school inside the suburb.
- Attwood ★ 94
What lifts Attwood to #2 is a recorded crime rate of about 30 offences per 1,000 residents (safety score 88/100); it also has 84% of it within 400 m of a park, and 20.1 ha of parkland per 1,000 residents.
- Diamond Creek ★ 93
#3 Diamond Creek — a recorded crime rate of about 29 offences per 1,000 residents (safety score 90/100), plus 3 government primary schools and 1 secondary inside the suburb, and a median house price of $1.06m (Oct–Dec 2025).
- Taylors Hill ★ 93
Taylors Hill ranks #4: a recorded crime rate of about 20 offences per 1,000 residents (safety score 96/100), 100% of it within 400 m of a park, and 2 government primary schools and 1 secondary inside the suburb.
- Seabrook ★ 93
Seabrook (#5) scores on a recorded crime rate of about 24 offences per 1,000 residents (safety score 96/100) and 100% of it within 400 m of a park, and 4.1 ha of parkland per 1,000 residents.
- Yarrambat ★ 92
#6 Yarrambat — a recorded crime rate of about 27 offences per 1,000 residents (safety score 91/100), plus 1 government primary school inside the suburb, and median rent of $450 a week.
- Eaglemont ★ 92
At #7, Eaglemont combines a recorded crime rate of about 35 offences per 1,000 residents (safety score 80/100) and 86% of it within 400 m of a park, and 11.1 ha of parkland per 1,000 residents.
- Plenty ★ 92
Plenty ranks #8: a recorded crime rate of about 38 offences per 1,000 residents (safety score 76/100), a median house price of $1.63m (Oct–Dec 2025), and median rent of $392 a week.
- Ivanhoe East ★ 92
What lifts Ivanhoe East to #9 is a recorded crime rate of about 36 offences per 1,000 residents (safety score 77/100); it also has 88% of it within 400 m of a park, and 1 government primary school inside the suburb.
- Burnside Heights ★ 91
What lifts Burnside Heights to #10 is a recorded crime rate of about 17 offences per 1,000 residents (safety score 98/100); it also has 100% of it within 400 m of a park, and 6.4 ha of parkland per 1,000 residents.
Why each of the top 10 value suburbs in Melbourne ranks where it does
Written from this page's own data: each figure below is the suburb's own value, set against the Melbourne median where we hold one.
1. Yallambie
Yallambie is #1 of 215 ranked Melbourne suburbs on this list, with a score of 98/100. Median rent is $340 a week, against a Melbourne median of $408, and its value score is 99/100. The trade-off: it scores 7/100 for cafés, so it is weaker there. It covers 2.9 km² with about 4,161 residents (census).
2. Attwood
Attwood is #2 of 215 ranked Melbourne suburbs on this list, with a score of 94/100. Median rent is $358 a week, against a Melbourne median of $408, and its value score is 97/100. The trade-off: it scores 1/100 for public transport, so it is weaker there. It covers 5 km² with about 3,309 residents (census).
3. Diamond Creek
Diamond Creek is #3 of 215 ranked Melbourne suburbs on this list, with a score of 93/100. Median rent is $430 a week, against a Melbourne median of $408, and its value score is 94/100. The trade-off: it scores 6/100 for public transport, so it is weaker there. It covers 17.5 km² with about 12,503 residents (census).
4. Taylors Hill
Taylors Hill is #4 of 215 ranked Melbourne suburbs on this list, with a score of 93/100. Median rent is $420 a week, against a Melbourne median of $408, and its value score is 91/100. The trade-off: it scores 24/100 for cafés, so it is weaker there. It covers 4.6 km² with about 15,419 residents (census).
5. Seabrook
Seabrook is #5 of 215 ranked Melbourne suburbs on this list, with a score of 93/100. Median rent is $361 a week, against a Melbourne median of $408, and its value score is 91/100. The trade-off: it scores 7/100 for cafés, so it is weaker there. It covers 1.5 km² with about 4,952 residents (census).
6. Yarrambat
Yarrambat is #6 of 215 ranked Melbourne suburbs on this list, with a score of 92/100. Median rent is $450 a week, against a Melbourne median of $408, and its value score is 93/100. The trade-off: it scores 2/100 for public transport, so it is weaker there. It covers 15.3 km² with about 1,602 residents (census).
7. Eaglemont
Eaglemont is #7 of 215 ranked Melbourne suburbs on this list, with a score of 92/100. Median rent is $453 a week, against a Melbourne median of $408, and its value score is 98/100. The trade-off: it scores 31/100 for public transport, so it is weaker there. It covers 2.2 km² with about 3,960 residents (census).
8. Plenty
Plenty is #8 of 215 ranked Melbourne suburbs on this list, with a score of 92/100. Median rent is $392 a week, against a Melbourne median of $408, and its value score is 100/100. The trade-off: it scores 2/100 for public transport, so it is weaker there. It covers 11.1 km² with about 2,575 residents (census).
9. Ivanhoe East
Ivanhoe East is #9 of 215 ranked Melbourne suburbs on this list, with a score of 92/100. Median rent is $451 a week, against a Melbourne median of $408, and its value score is 99/100. The trade-off: it scores 7/100 for cafés, so it is weaker there. It covers 2 km² with about 3,762 residents (census).
10. Burnside Heights
Burnside Heights is #10 of 215 ranked Melbourne suburbs on this list, with a score of 91/100. Median rent is $411 a week, against a Melbourne median of $408, and its value score is 88/100. The trade-off: it scores 7/100 for cafés, so it is weaker there. It covers 1.9 km² with about 6,377 residents (census).
How do these suburbs compare head to head?
What else do people ask about value suburbs in Melbourne?
What are the best value suburbs in Melbourne?
On our October 2026 data the top five are Yallambie (98/100), Attwood (94/100), Diamond Creek (93/100), Taylors Hill (93/100), Seabrook (93/100), out of 215 ranked Melbourne suburbs.
What are the cheapest and most affordable suburbs in Melbourne?
Best value is not the same as cheapest: this list weighs what a suburb offers against its rent. By median weekly rent alone, the cheapest Melbourne suburbs with at least 2,000 residents are Flemington ($300/wk), Albion ($301/wk), Heidelberg West ($306/wk), Braybrook ($312/wk), Campbellfield ($320/wk). Measured as rent against local household income, the most affordable are Plenty (12%), Yallambie (15%), Ivanhoe East (15%). Figures are ABS Census 2021 medians, so today's rents are higher.
How is this ranking calculated?
The value score — amenity, safety and access measured against median rent — blended with the raw rent percentile. Suburbs whose rental market is too thin to score reliably are left out rather than guessed at. 215 of 216 Melbourne suburbs had enough data to be ranked. Updated October 2026.
Is this ranking sponsored?
No. No ranking on this site is sold or sponsored. It is computed from open data: GPS activity traces, official crime statistics, the ABS census and OpenStreetMap.
What other Melbourne rankings are there?
Sources: open GPS activity traces, official crime statistics, ABS census,
OpenStreetMap (ODbL). Sale prices: Victorian Property Sales Report, October–December 2025 quarter — © State of Victoria (Department of Transport and Planning / Valuer-General Victoria), Victorian Property Sales Report, CC BY 4.0. Quarterly median of sales settled in the quarter, per suburb. Figures marked as low-volume rest on fewer than 10 sales that quarter. No ranking on this site is sold or sponsored.
← all 216 Melbourne suburbs, with sliders