Safest suburbs in Melbourne
Ranked on recorded offences per 1,000 residents, from official statistics.
Montmorency (100/100), Eltham North (99/100), Gowanbrae (99/100) lead this ranking of 216 Melbourne suburbs.
By BestSuburbs research · Updated October 2026
Part of Melbourne suburb rankings · all Melbourne lists
Which Melbourne suburbs are the safest?
How do the top 25 compare, measure by measure?
| # | Suburb | Offences per 1,000 | Safety score | Median house price |
|---|---|---|---|---|
| 1 | 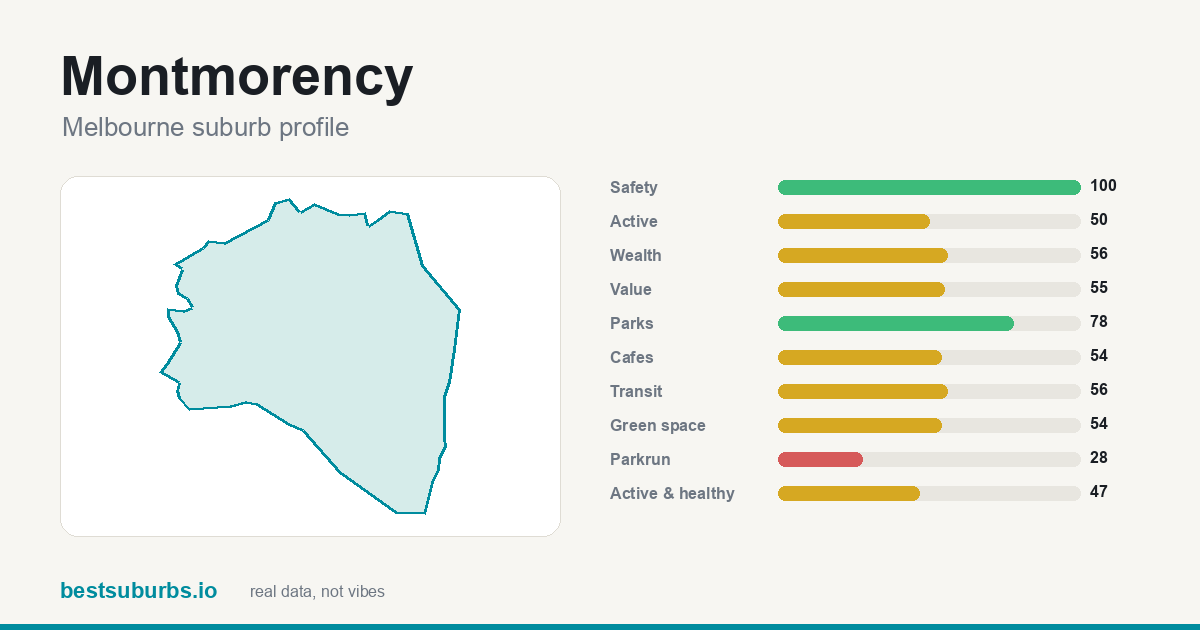 Montmorency Montmorency | 12.8 | 100 | $1,180,000 |
| 2 | 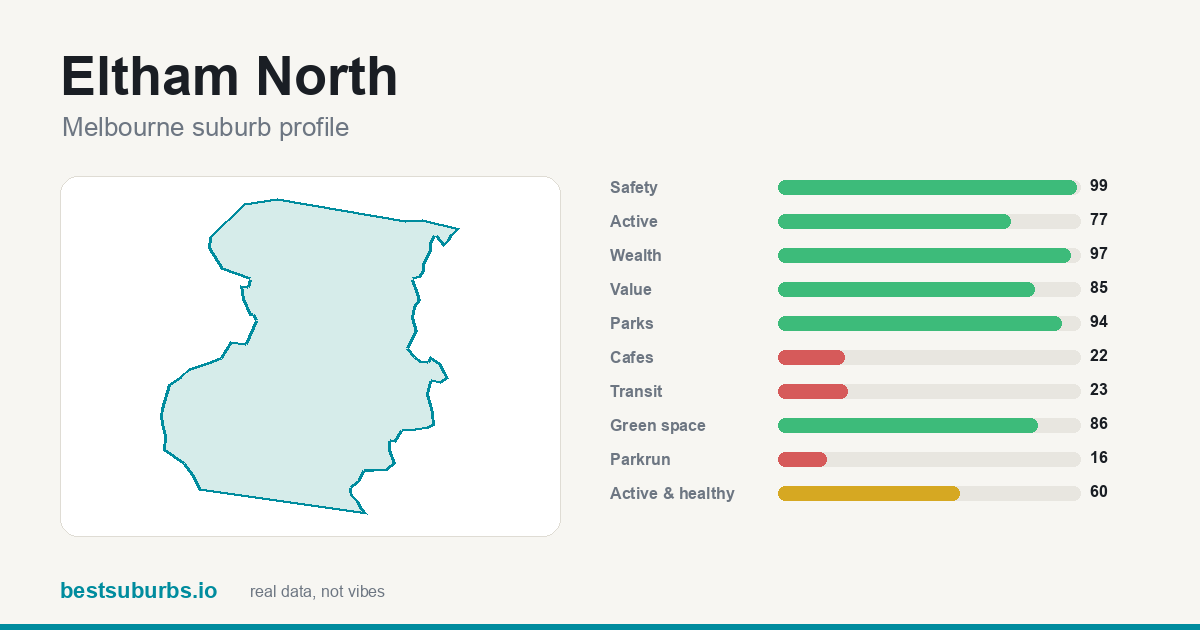 Eltham North Eltham North | 14.2 | 99 | $1,218,900 |
| 3 | 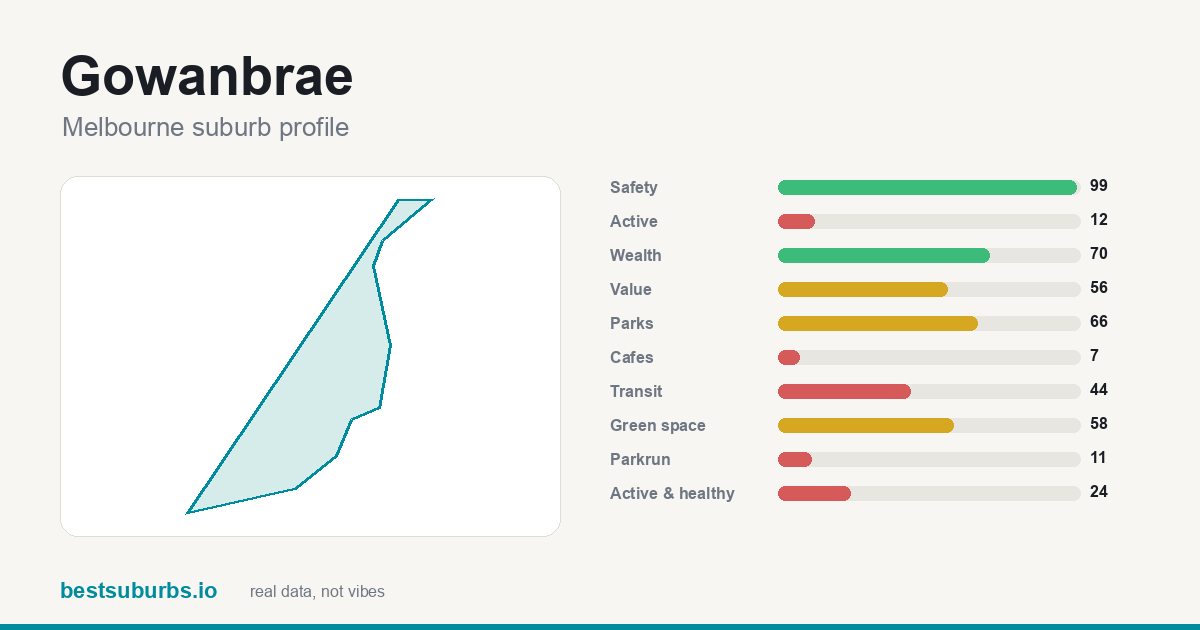 Gowanbrae Gowanbrae | 15.8 | 99 | $960,000 |
| 4 | 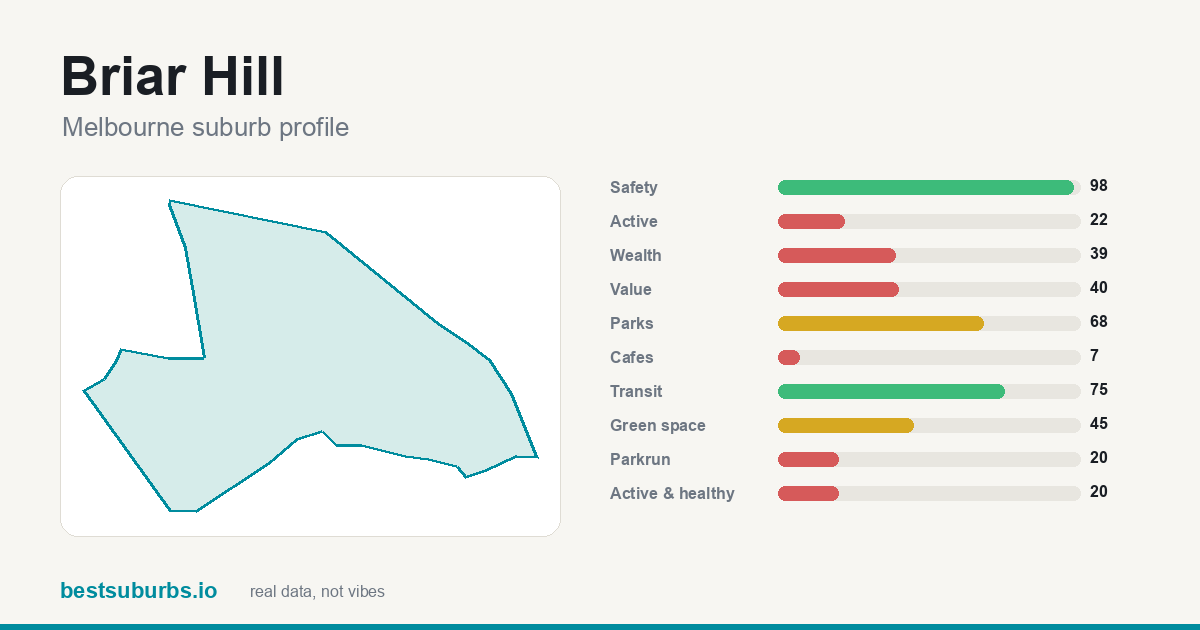 Briar Hill Briar Hill | 16.1 | 98 | $996,000 |
| 5 | 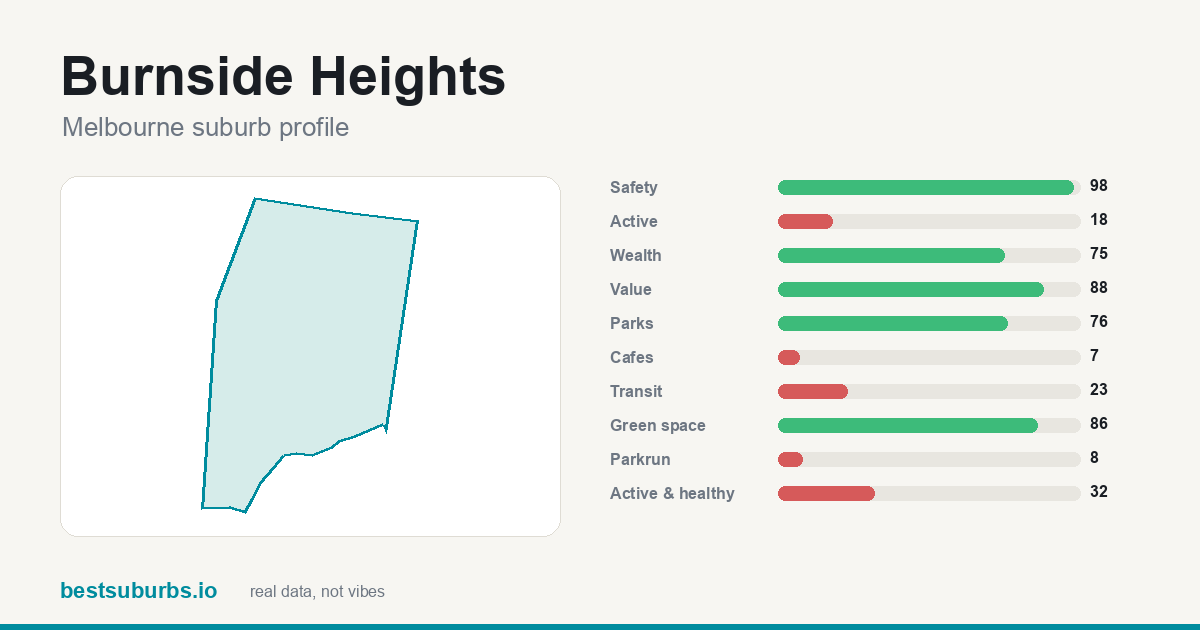 Burnside Heights Burnside Heights | 17.1 | 98 | $770,000 |
| 6 | 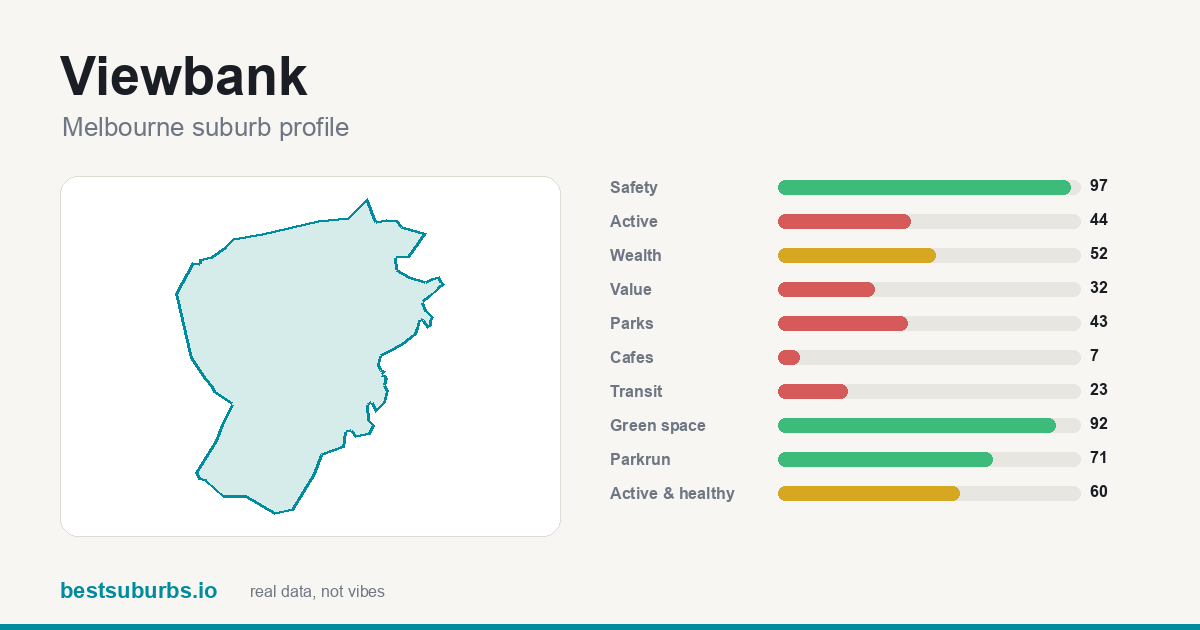 Viewbank Viewbank | 17.5 | 97 | $1,295,500 |
| 7 | 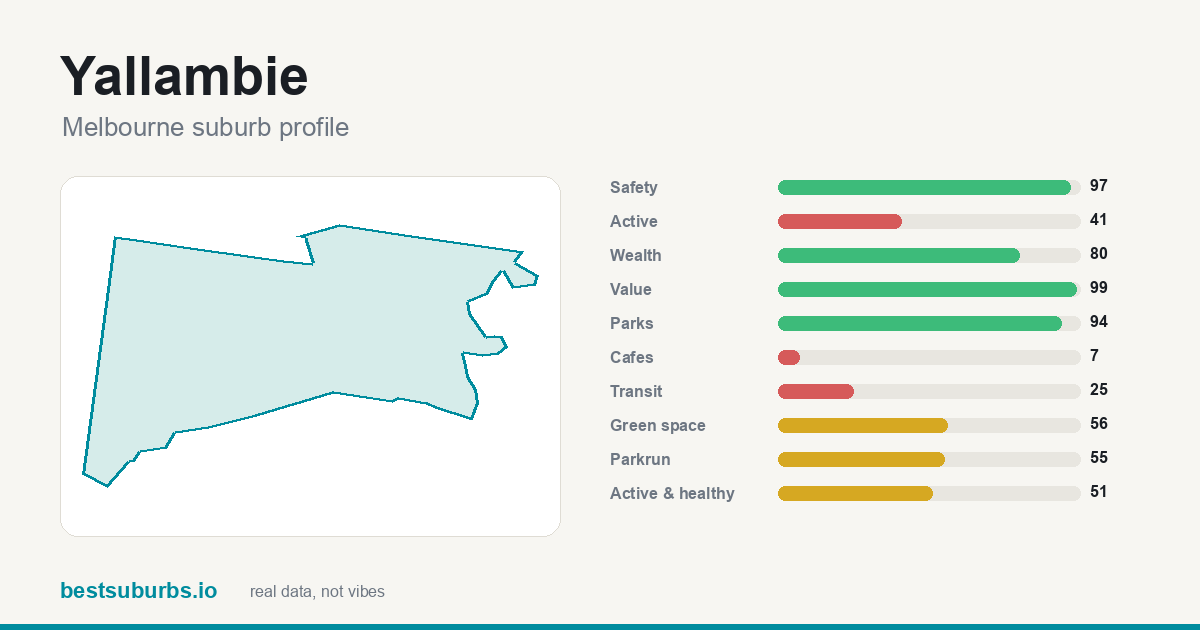 Yallambie Yallambie | 19.5 | 97 | $1,026,800 |
| 8 | 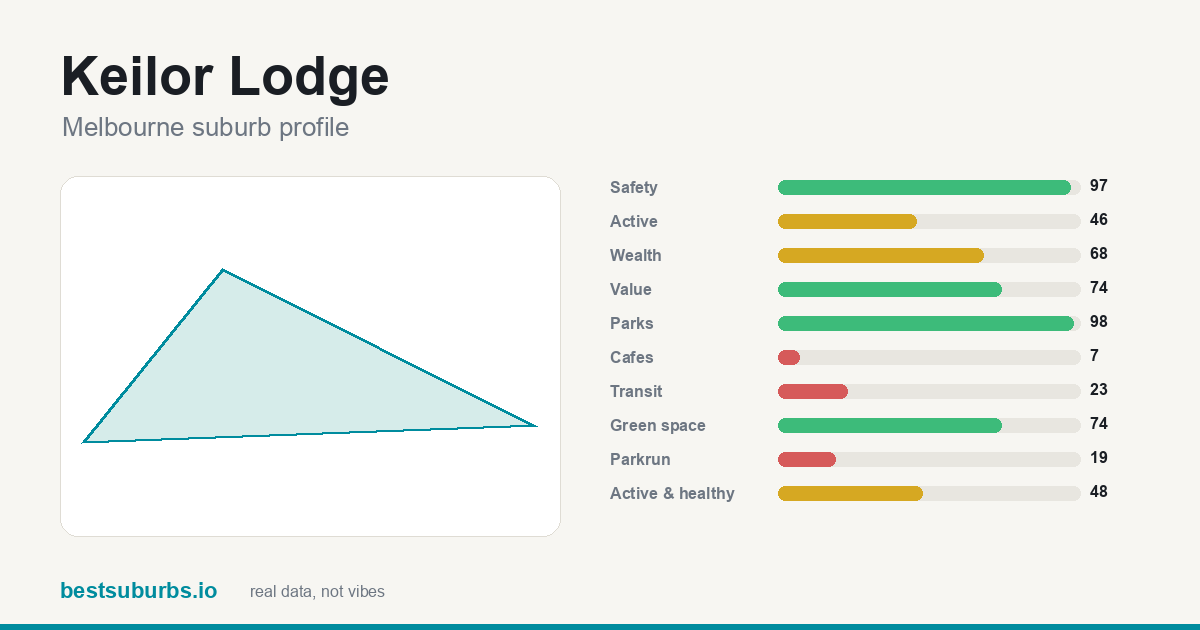 Keilor Lodge Keilor Lodge | 17.4 | 97 | $1,090,500 |
| 9 | 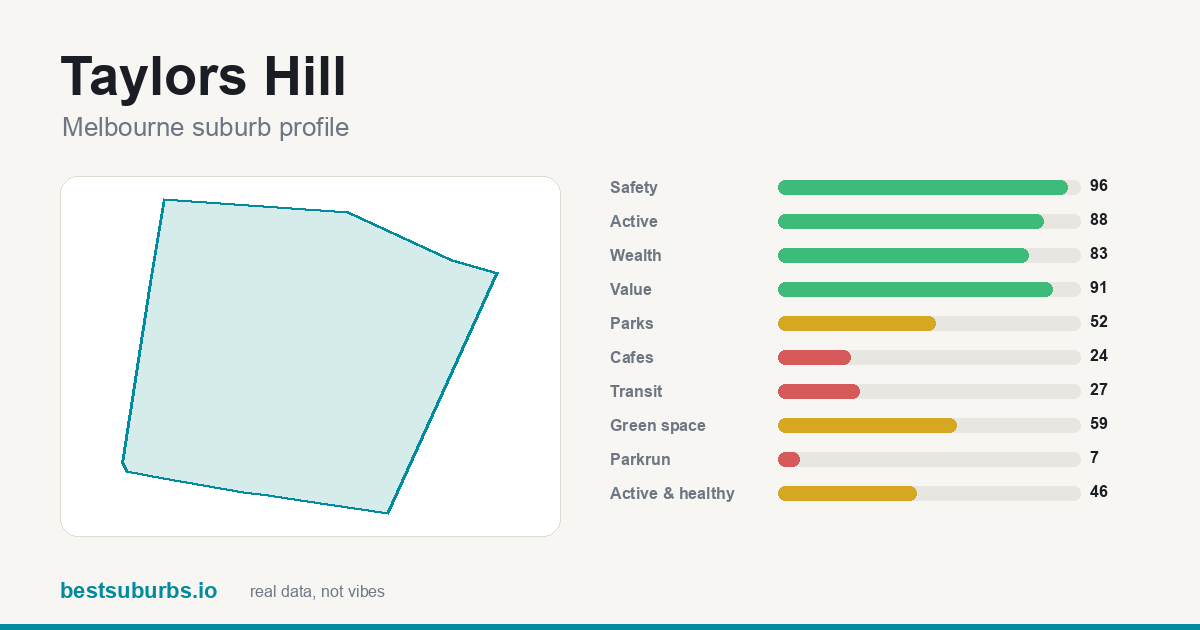 Taylors Hill Taylors Hill | 20.4 | 96 | $938,000 |
| 10 | 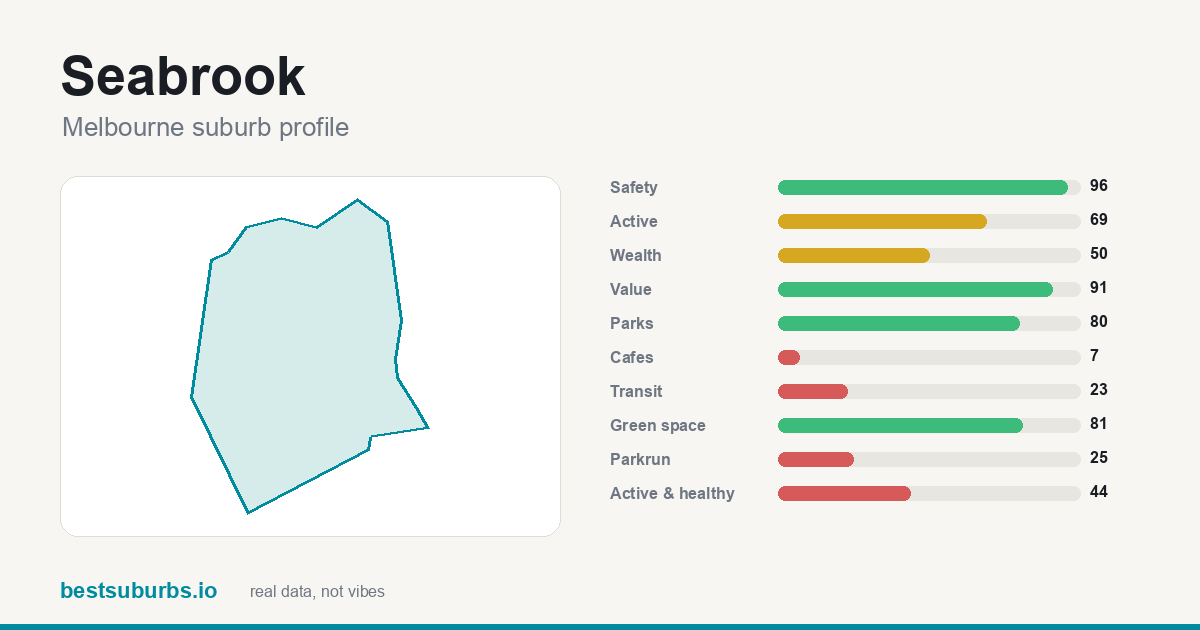 Seabrook Seabrook | 24.0 | 96 | $811,000 |
| 11 | 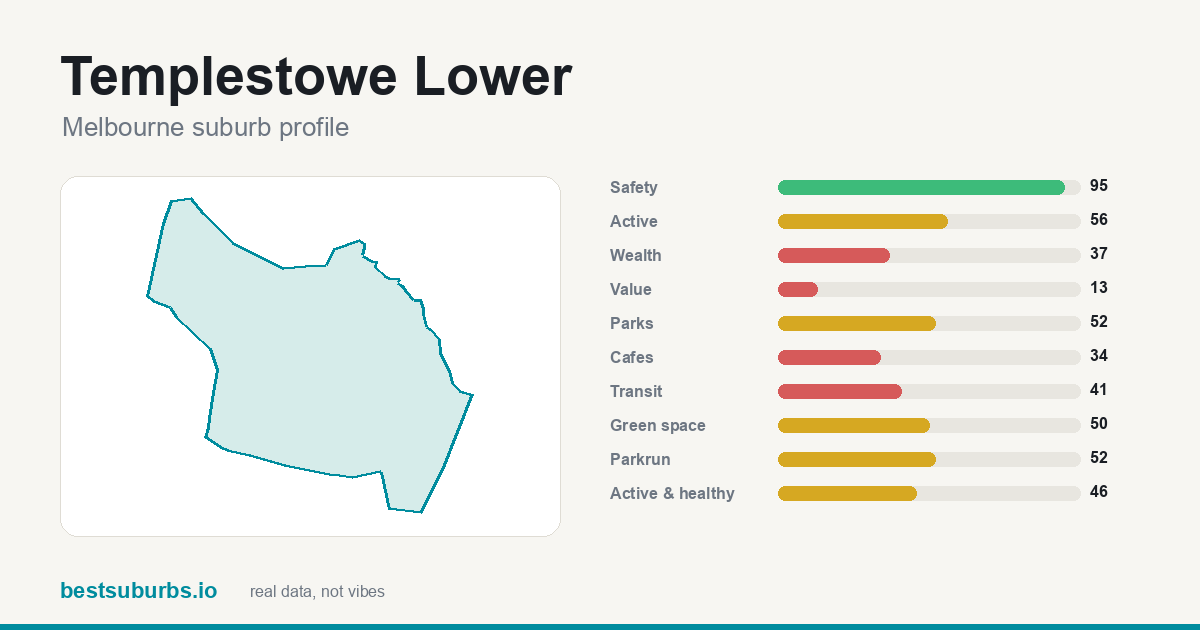 Templestowe Lower Templestowe Lower | 24.5 | 95 | $1,378,000 |
| 12 | 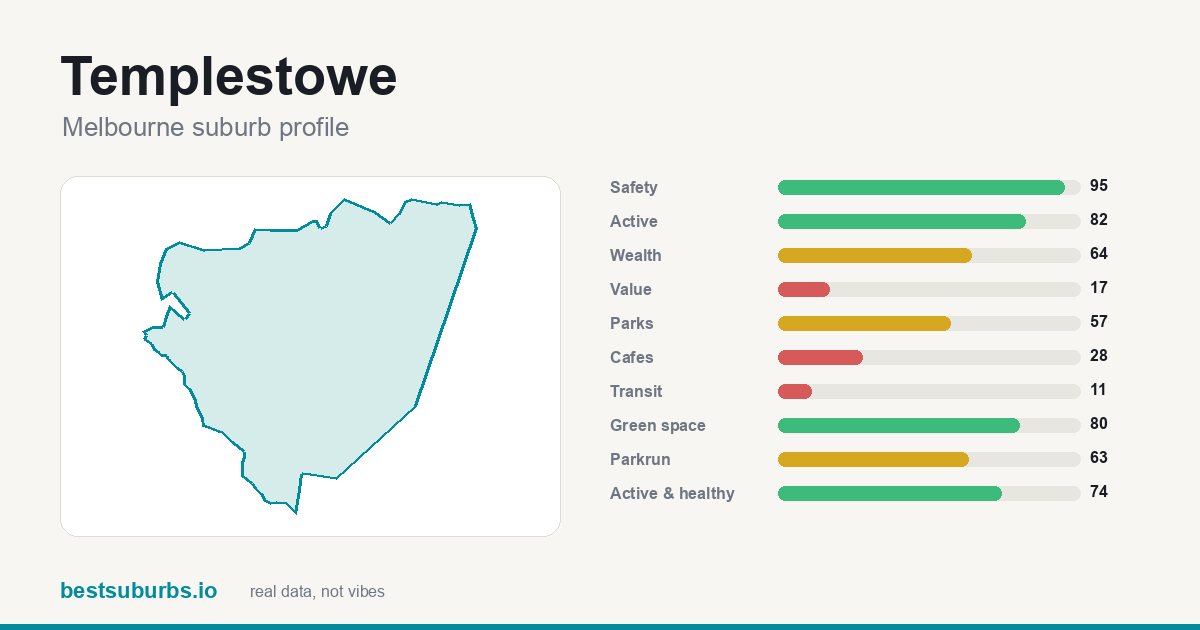 Templestowe Templestowe | 24.7 | 95 | $1,757,500 |
| 13 | 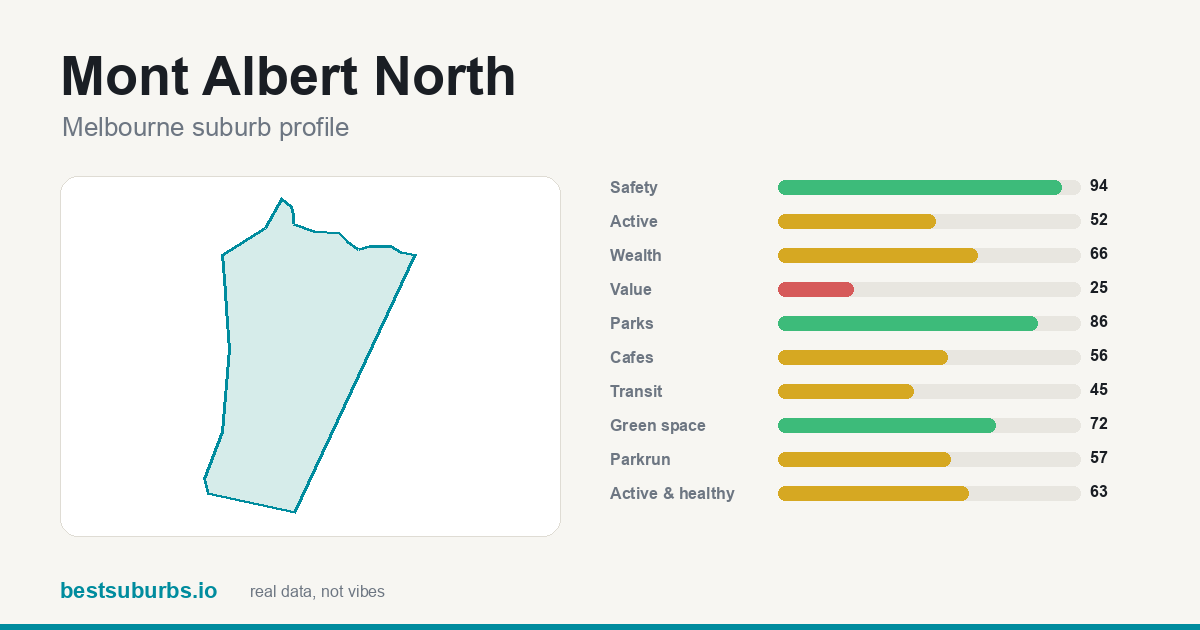 Mont Albert North Mont Albert North | 25.3 | 94 | $1,710,000 |
| 14 | 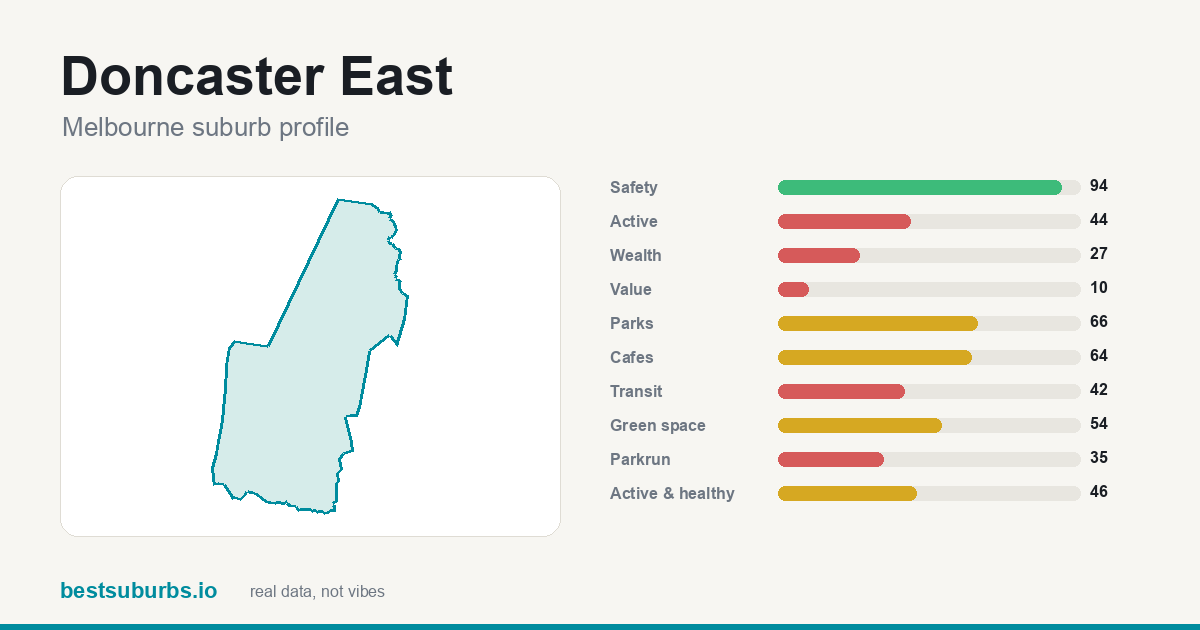 Doncaster East Doncaster East | 25.4 | 94 | $1,655,000 |
| 15 | 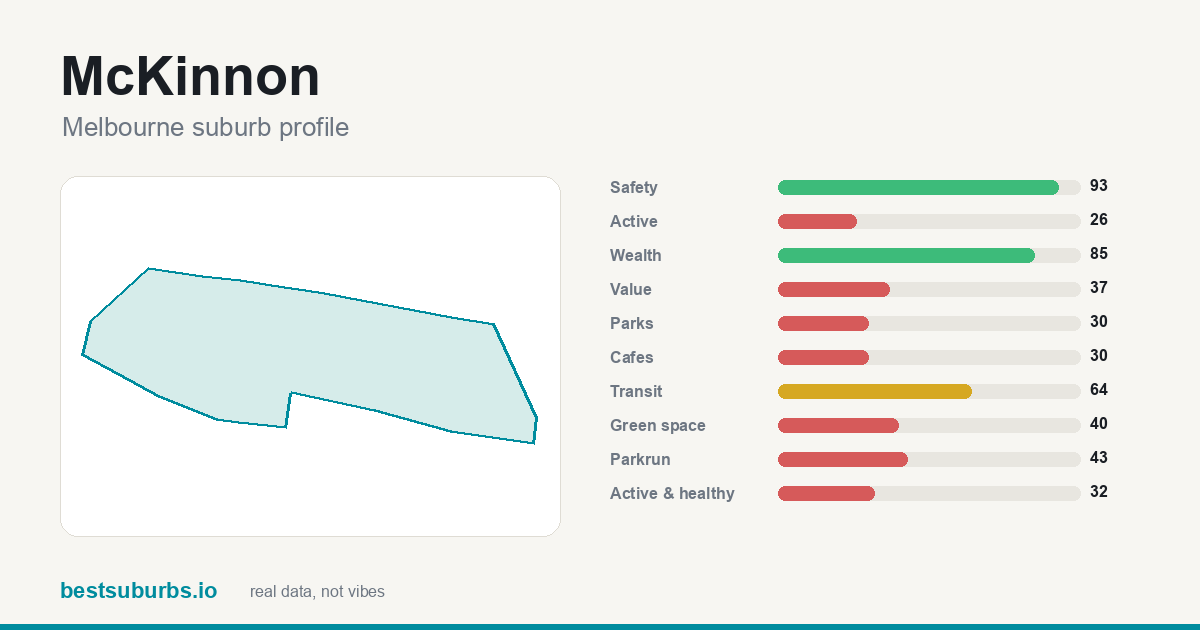 McKinnon McKinnon | 25.7 | 93 | $1,900,000 |
| 16 | 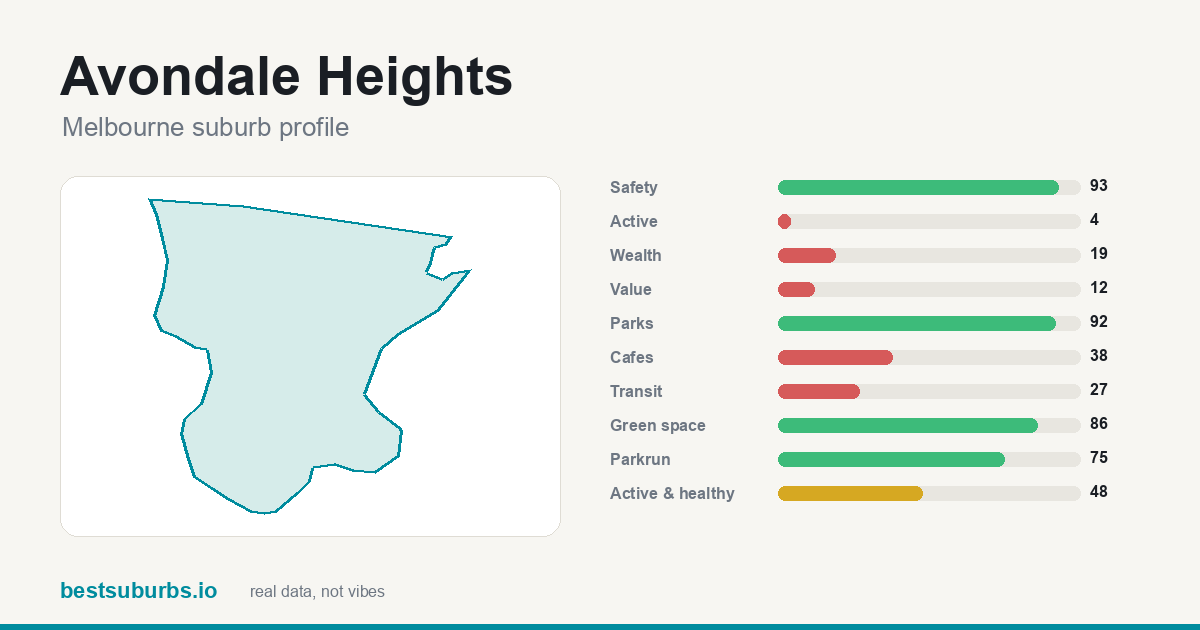 Avondale Heights Avondale Heights | 25.6 | 93 | $1,085,000 |
| 17 | 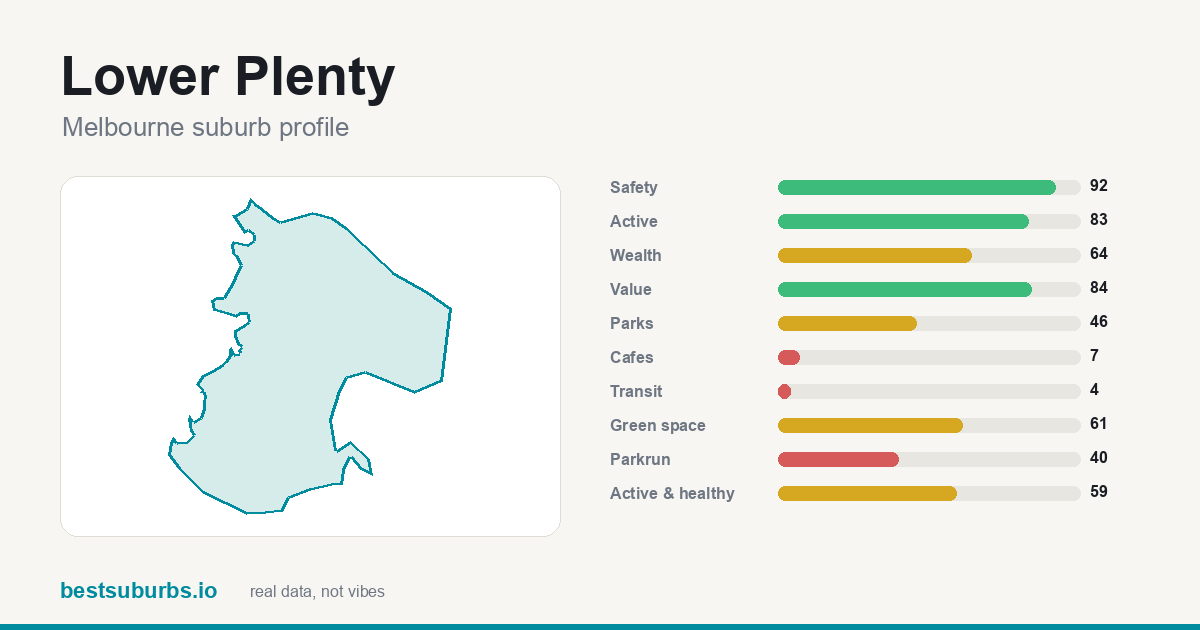 Lower Plenty Lower Plenty | 26.0 | 92 | $1,200,000 |
| 18 | 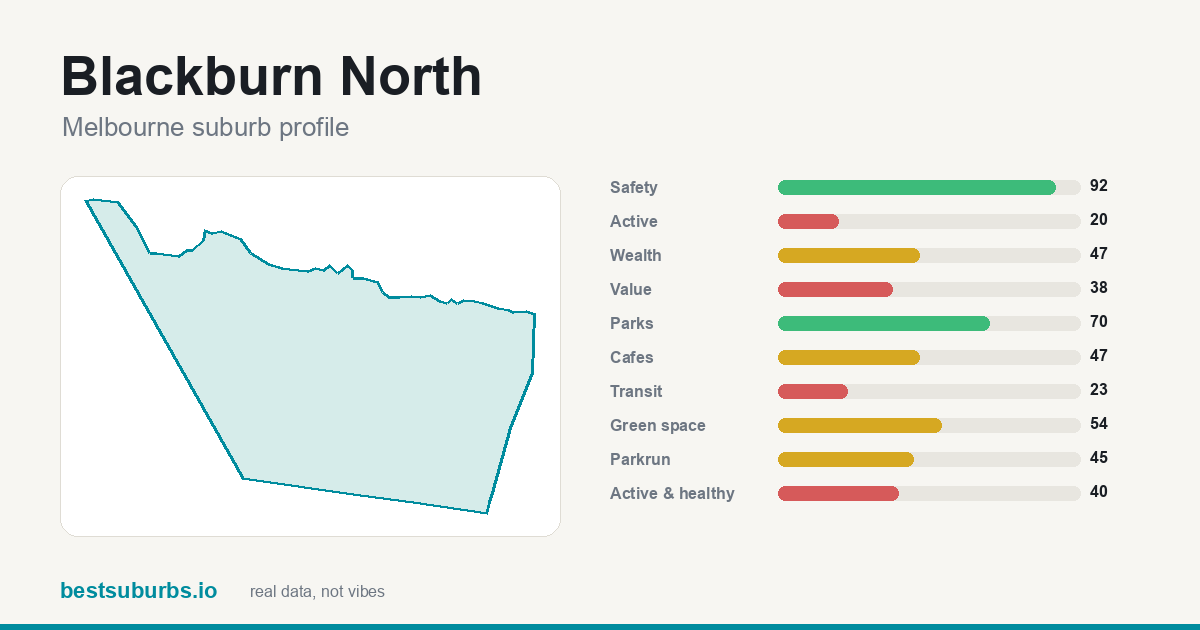 Blackburn North Blackburn North | 26.4 | 92 | $1,465,000 |
| 19 | 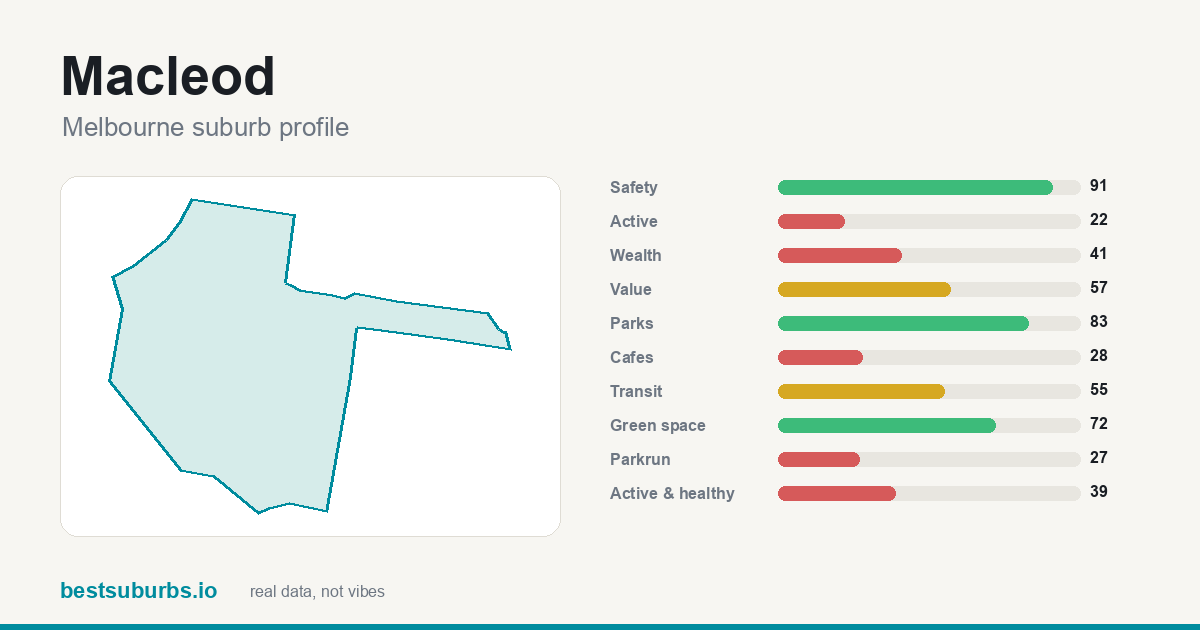 Macleod Macleod | 28.7 | 91 | $1,101,000 |
| 20 | 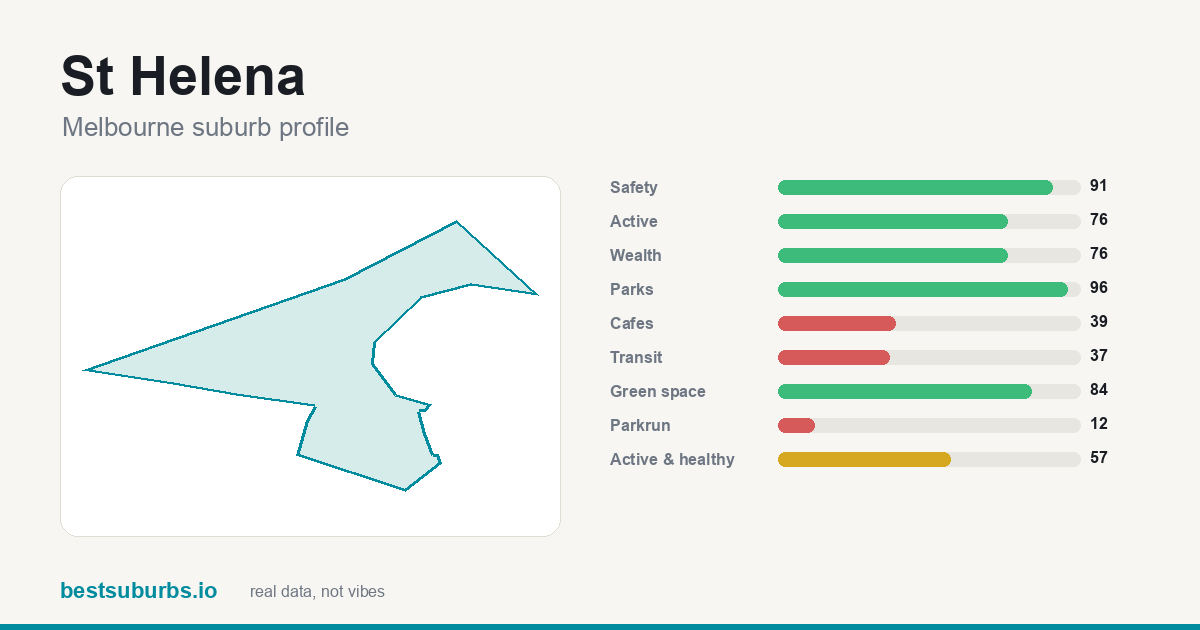 St Helena St Helena | 27.7 | 91 | $1,320,000 |
| 21 | 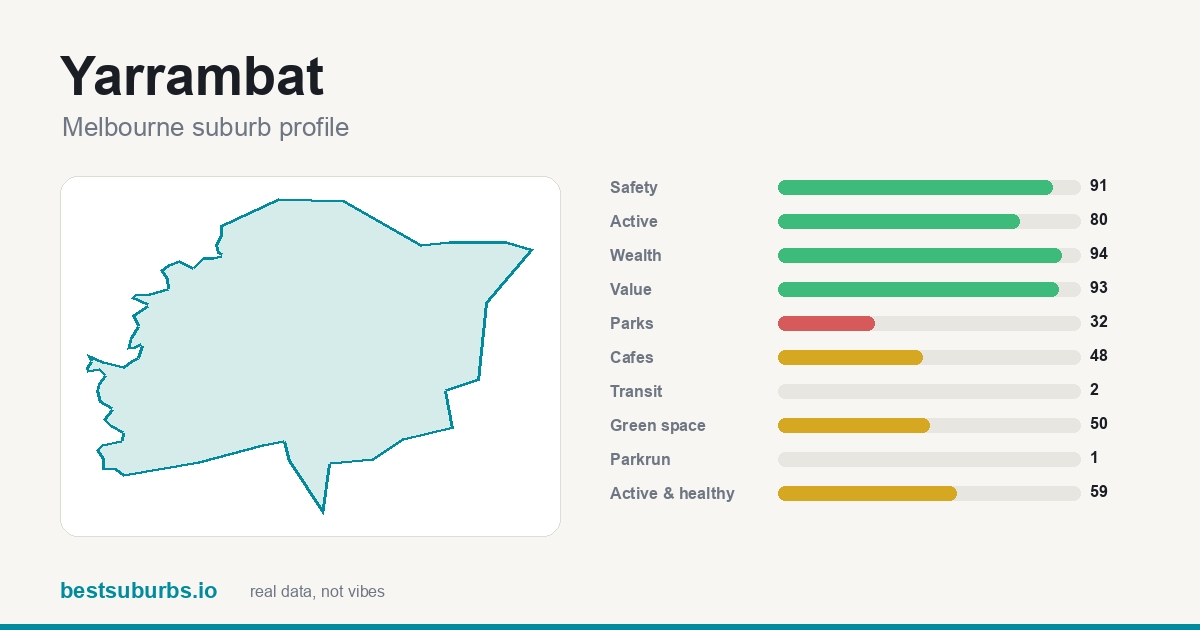 Yarrambat Yarrambat | 26.8 | 91 | — |
| 22 | 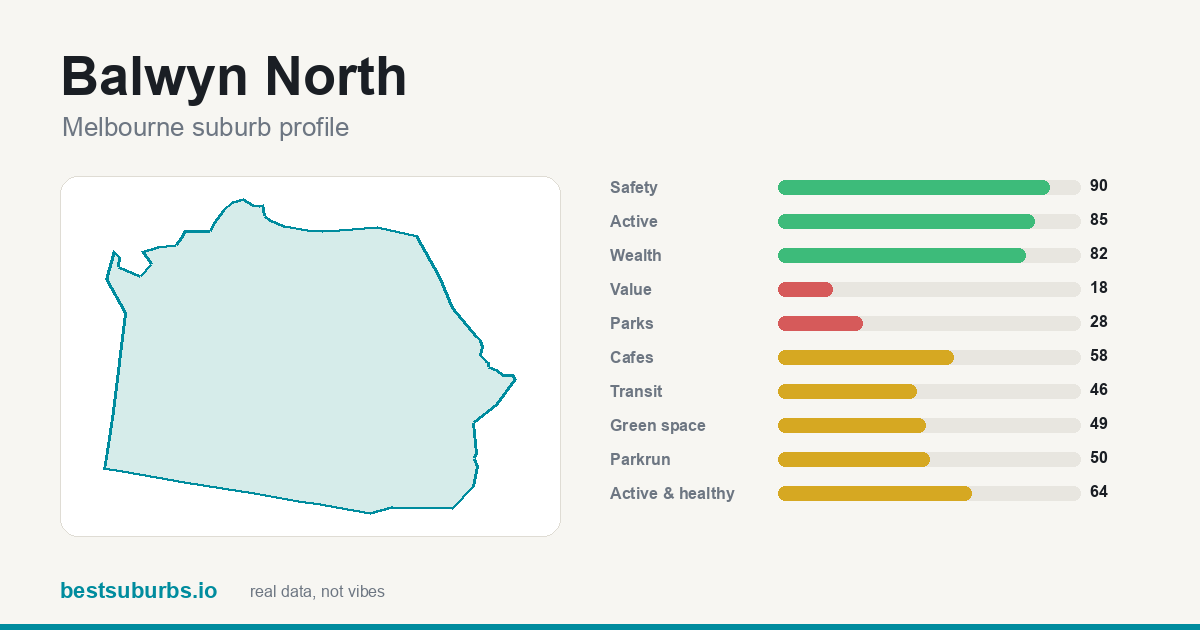 Balwyn North Balwyn North | 29.5 | 90 | $2,360,000 |
| 23 | 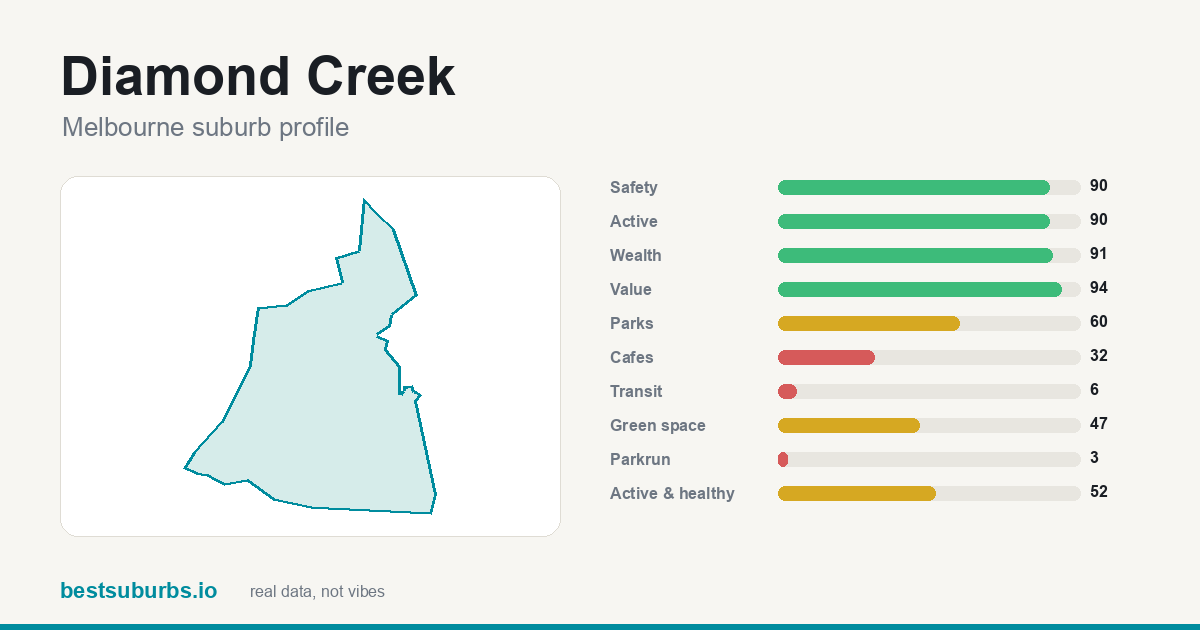 Diamond Creek Diamond Creek | 29.1 | 90 | $1,060,000 |
| 24 | 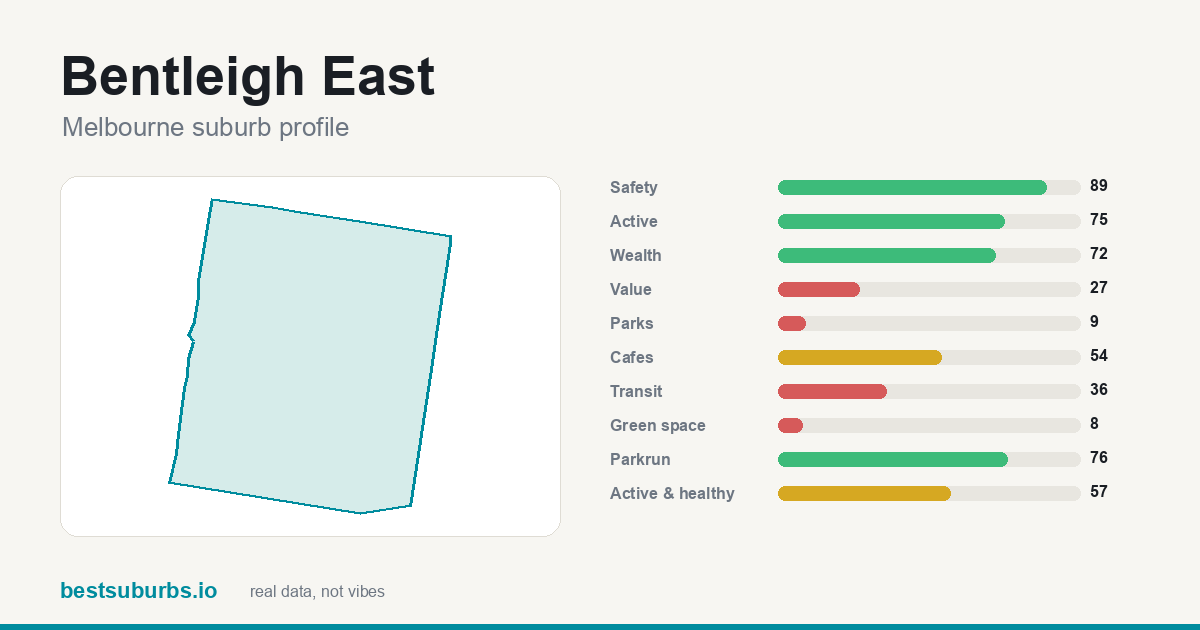 Bentleigh East Bentleigh East | 29.9 | 89 | $1,608,500 |
| 25 | 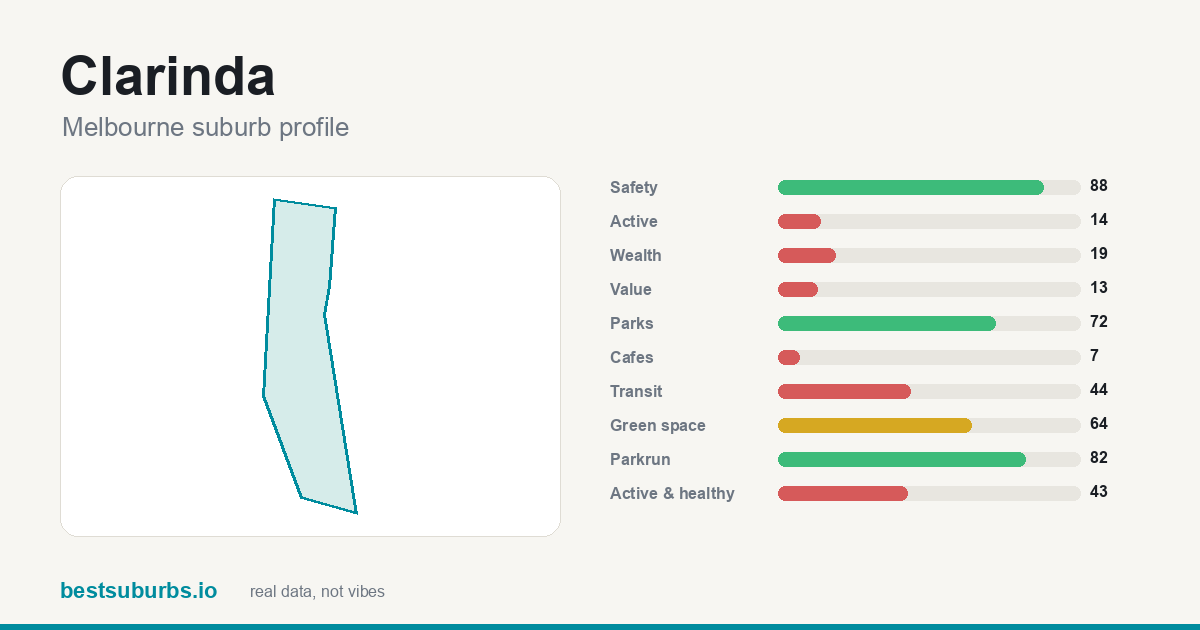 Clarinda Clarinda | 30.1 | 88 | $1,098,500 |
Showing the top 25 of 216 ranked suburbs. Scores are percentiles against every other suburb in Melbourne: 100 is the best in the city, 50 is mid-table. Click any suburb for its full profile.
Why are these the 10 safest suburbs in Melbourne? (October 2026)
Updated 14 October 2026 · one sentence of real reasons per suburb, from the data on this page.
- Montmorency ★ 100
#1 Montmorency — a recorded crime rate of about 13 offences per 1,000 residents (safety score 100/100), plus 89% of it within 400 m of a park, and 3 government primary schools and 1 secondary inside the suburb.
- Eltham North ★ 99
Eltham North takes #2 on a recorded crime rate of about 14 offences per 1,000 residents (safety score 99/100), with 100% of it within 400 m of a park, and 3 government primary schools and 1 secondary inside the suburb.
- Gowanbrae ★ 99
Gowanbrae takes #3 on a recorded crime rate of about 16 offences per 1,000 residents (safety score 99/100), with 83% of it within 400 m of a park, and a median house price of $960k (Oct–Dec 2025).
- Briar Hill ★ 98
Briar Hill ranks #4: a recorded crime rate of about 16 offences per 1,000 residents (safety score 98/100), 96% of it within 400 m of a park, and 2 government primary schools inside the suburb.
- Burnside Heights ★ 98
Burnside Heights (#5) scores on a recorded crime rate of about 17 offences per 1,000 residents (safety score 98/100) and 100% of it within 400 m of a park, and 6.4 ha of parkland per 1,000 residents.
- Viewbank ★ 97
At #6, Viewbank combines a recorded crime rate of about 18 offences per 1,000 residents (safety score 97/100) and 99% of it within 400 m of a park, and 24.8 ha of parkland per 1,000 residents.
- Yallambie ★ 97
At #7, Yallambie combines a recorded crime rate of about 20 offences per 1,000 residents (safety score 97/100) and 80% of it within 400 m of a park, and 1 government primary school inside the suburb.
- Keilor Lodge ★ 97
Keilor Lodge (#8) scores on a recorded crime rate of about 17 offences per 1,000 residents (safety score 97/100) and 100% of it within 400 m of a park, and 1 secondary inside the suburb.
- Taylors Hill ★ 96
At #9, Taylors Hill combines a recorded crime rate of about 20 offences per 1,000 residents (safety score 96/100) and 100% of it within 400 m of a park, and 2 government primary schools and 1 secondary inside the suburb.
- Seabrook ★ 96
What lifts Seabrook to #10 is a recorded crime rate of about 24 offences per 1,000 residents (safety score 96/100); it also has 100% of it within 400 m of a park, and 4.1 ha of parkland per 1,000 residents.
Why each of the top 10 safest suburbs in Melbourne ranks where it does
Written from this page's own data: each figure below is the suburb's own value, set against the Melbourne median where we hold one.
1. Montmorency
Montmorency is #1 of 216 ranked Melbourne suburbs on this list, with a score of 100/100. It recorded 12.8 offences per 1,000 residents, against a Melbourne median of 60.4. The trade-off: it scores 38/100 for public transport, so it is weaker there. It covers 3.8 km² with about 9,250 residents (census).
2. Eltham North
Eltham North is #2 of 216 ranked Melbourne suburbs on this list, with a score of 99/100. It recorded 14.2 offences per 1,000 residents, against a Melbourne median of 60.4. The trade-off: it scores 16/100 for public transport, so it is weaker there. It covers 4 km² with about 6,830 residents (census).
3. Gowanbrae
Gowanbrae is #3 of 216 ranked Melbourne suburbs on this list, with a score of 99/100. It recorded 15.8 offences per 1,000 residents, against a Melbourne median of 60.4. The trade-off: it scores 7/100 for cafés, so it is weaker there. It covers 1.2 km² with about 2,971 residents (census).
4. Briar Hill
Briar Hill is #4 of 216 ranked Melbourne suburbs on this list, with a score of 98/100. It recorded 16.1 offences per 1,000 residents, against a Melbourne median of 60.4. The trade-off: it scores 7/100 for cafés, so it is weaker there. It covers 1.3 km² with about 3,220 residents (census).
5. Burnside Heights
Burnside Heights is #5 of 216 ranked Melbourne suburbs on this list, with a score of 98/100. It recorded 17.1 offences per 1,000 residents, against a Melbourne median of 60.4. The trade-off: it scores 7/100 for cafés, so it is weaker there. It covers 1.9 km² with about 6,377 residents (census).
6. Viewbank
Viewbank is #6 of 216 ranked Melbourne suburbs on this list, with a score of 97/100. It recorded 17.5 offences per 1,000 residents, against a Melbourne median of 60.4. The trade-off: it scores 5/100 for public transport, so it is weaker there. It covers 4.6 km² with about 7,030 residents (census).
7. Yallambie
Yallambie is #7 of 216 ranked Melbourne suburbs on this list, with a score of 97/100. It recorded 19.5 offences per 1,000 residents, against a Melbourne median of 60.4. The trade-off: it scores 7/100 for cafés, so it is weaker there. It covers 2.9 km² with about 4,161 residents (census).
8. Keilor Lodge
Keilor Lodge is #8 of 216 ranked Melbourne suburbs on this list, with a score of 97/100. It recorded 17.4 offences per 1,000 residents, against a Melbourne median of 60.4. The trade-off: it scores 7/100 for cafés, so it is weaker there. It covers 0.7 km² with about 1,668 residents (census).
9. Taylors Hill
Taylors Hill is #9 of 216 ranked Melbourne suburbs on this list, with a score of 96/100. It recorded 20.4 offences per 1,000 residents, against a Melbourne median of 60.4. The trade-off: it scores 24/100 for cafés, so it is weaker there. It covers 4.6 km² with about 15,419 residents (census).
10. Seabrook
Seabrook is #10 of 216 ranked Melbourne suburbs on this list, with a score of 96/100. It recorded 24 offences per 1,000 residents, against a Melbourne median of 60.4. The trade-off: it scores 7/100 for cafés, so it is weaker there. It covers 1.5 km² with about 4,952 residents (census).
How do these suburbs compare head to head?
What else do people ask about safest suburbs in Melbourne?
What are the safest suburbs in Melbourne?
On our October 2026 data the top five are Montmorency (100/100), Eltham North (99/100), Gowanbrae (99/100), Briar Hill (98/100), Burnside Heights (98/100), out of 216 ranked Melbourne suburbs.
Which suburbs have the highest recorded crime rate in Melbourne?
On the same official statistics, the highest recorded offence rates per 1,000 residents among 216 ranked Melbourne suburbs are Melbourne (326 per 1,000), Sunshine (272 per 1,000), South Melbourne (245 per 1,000), Ravenhall (244 per 1,000), Campbellfield (239 per 1,000). The rate is per resident, so city-centre, shopping-centre and industrial suburbs with few residents and many visitors or workers score high; it measures recorded offences, not how safe a street feels to live on.
How is this ranking calculated?
Purely the safety score: recorded offences per 1,000 residents from the official crime statistics agency, converted to a percentile against every other suburb in the city. Nothing else is mixed in. 216 of 216 Melbourne suburbs had enough data to be ranked. Updated October 2026.
Is this ranking sponsored?
No. No ranking on this site is sold or sponsored. It is computed from open data: GPS activity traces, official crime statistics, the ABS census and OpenStreetMap.
What other Melbourne rankings are there?
Sources: open GPS activity traces, official crime statistics, ABS census,
OpenStreetMap (ODbL). Sale prices: Victorian Property Sales Report, October–December 2025 quarter — © State of Victoria (Department of Transport and Planning / Valuer-General Victoria), Victorian Property Sales Report, CC BY 4.0. Quarterly median of sales settled in the quarter, per suburb. Figures marked as low-volume rest on fewer than 10 sales that quarter. No ranking on this site is sold or sponsored.
← all 216 Melbourne suburbs, with sliders