Wealthiest suburbs in Sydney
Median household income from the census. No estimates, no agent opinions.
Riverview (100/100), Longueville (100/100), Willoughby East (99/100) lead this ranking of 422 Sydney suburbs.
By BestSuburbs research · Updated October 2026
Part of Sydney suburb rankings · all Sydney lists
Which are the wealthiest suburbs in Sydney?
How do the top 25 compare, measure by measure?
| # | Suburb | Median household income ($/wk) | Wealth score | Median house price |
|---|---|---|---|---|
| 1 | 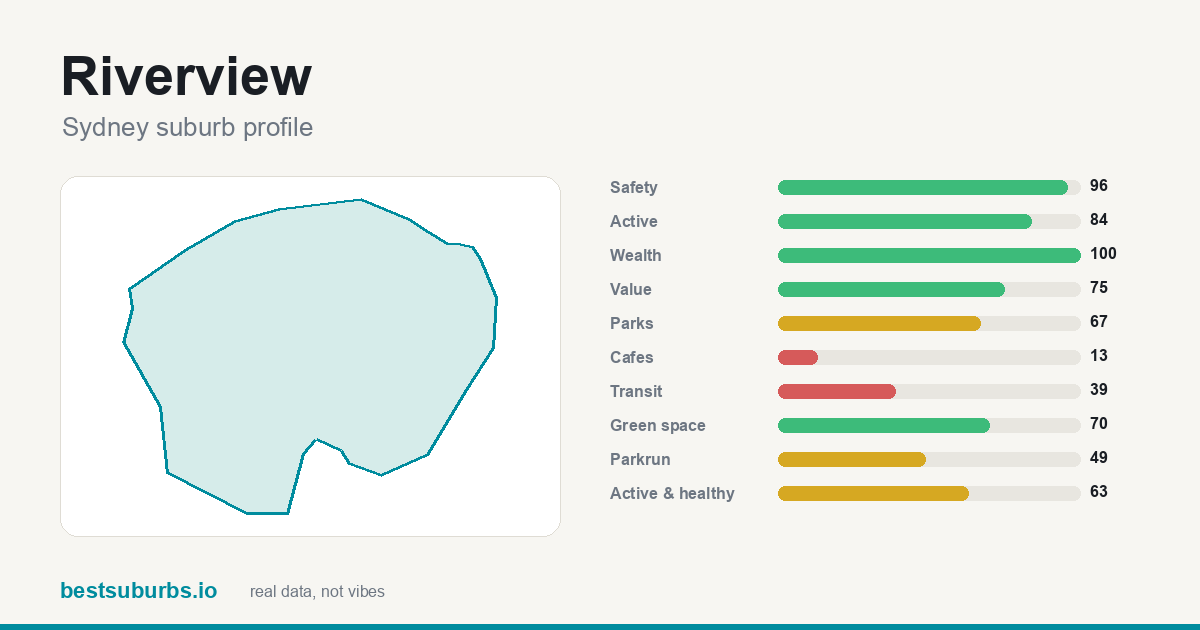 Riverview Riverview | 4,731 | 100 | $3,425,000 |
| 2 | 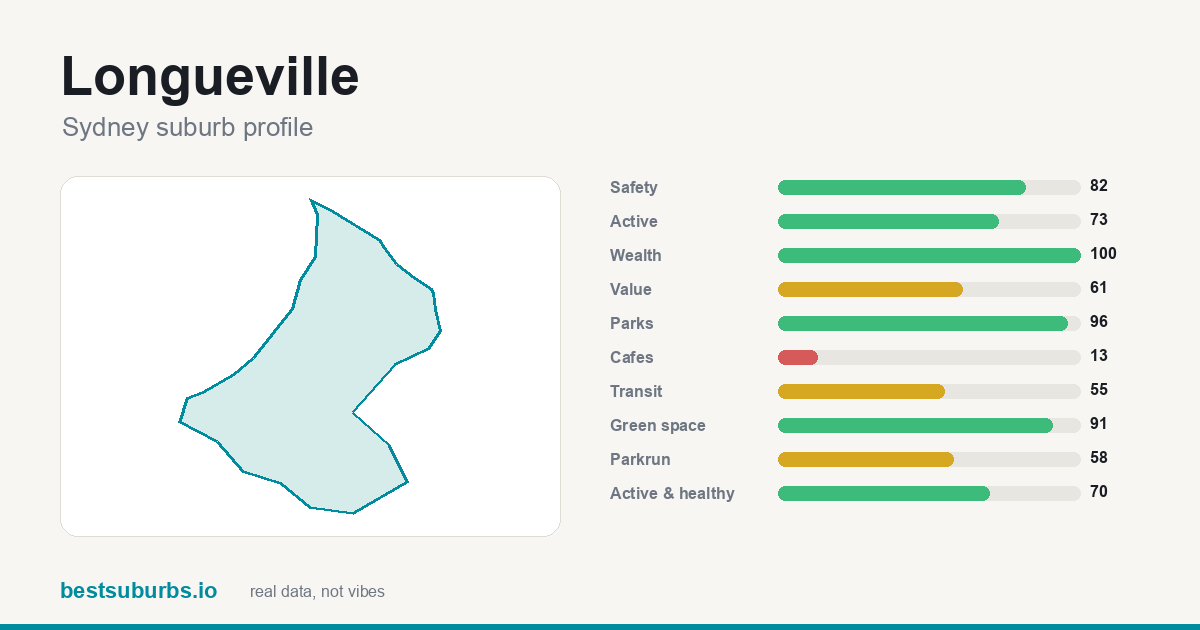 Longueville Longueville | 4,894 | 100 | $3,425,000 |
| 3 | 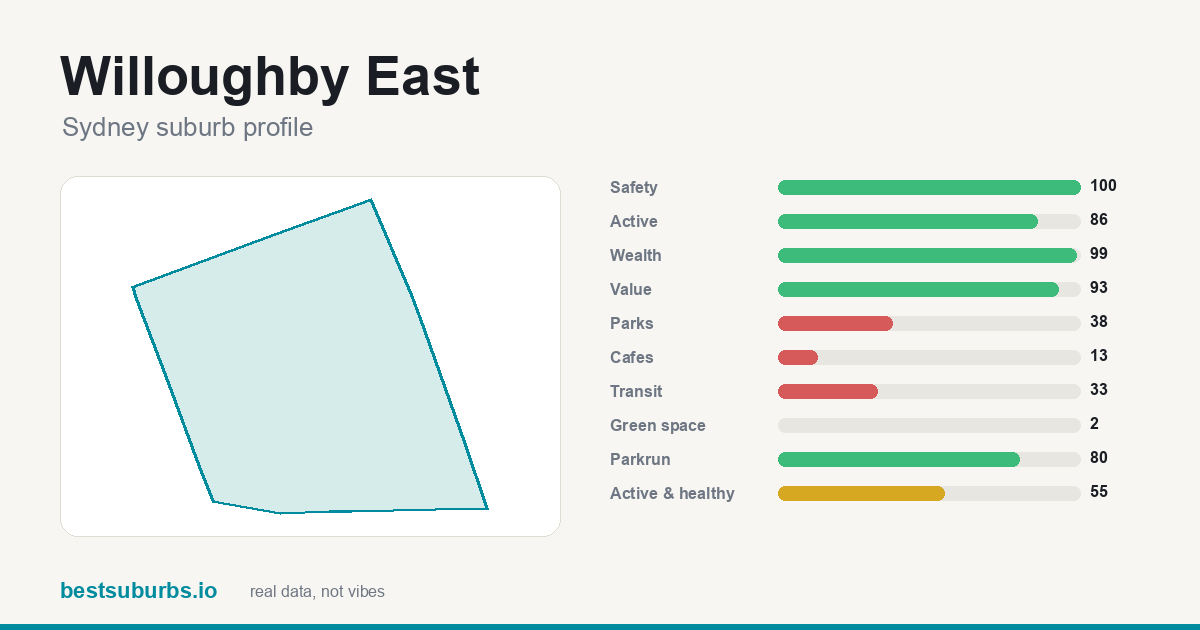 Willoughby East Willoughby East | 4,536 | 99 | $3,600,000 |
| 4 | 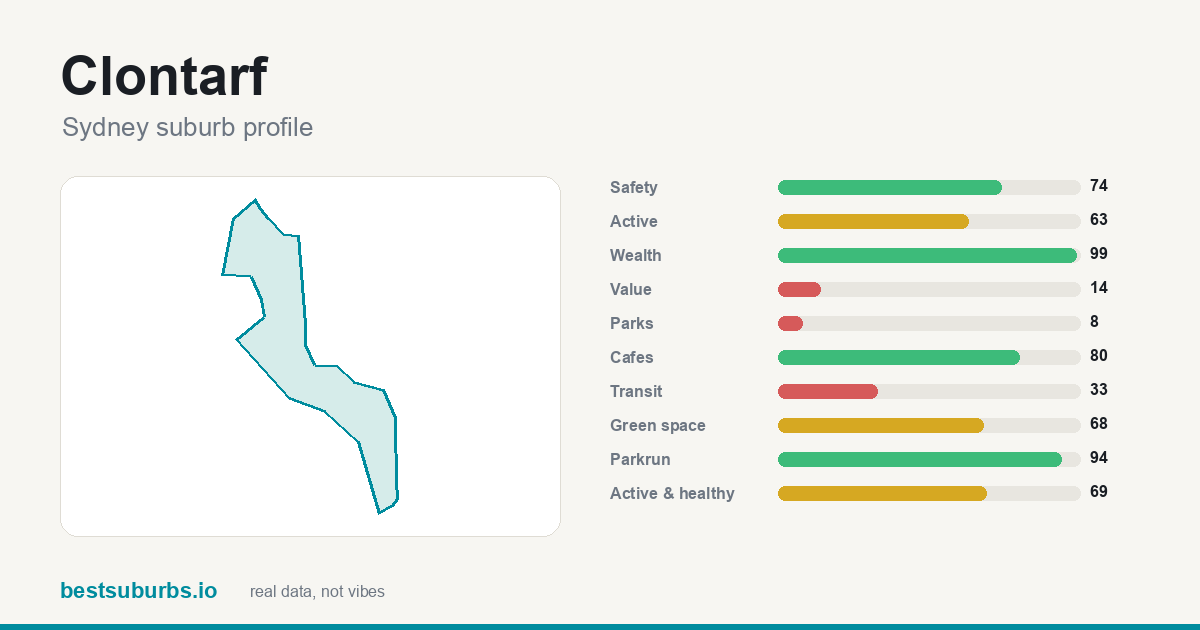 Clontarf Clontarf | 4,609 | 99 | $3,825,000 |
| 5 | 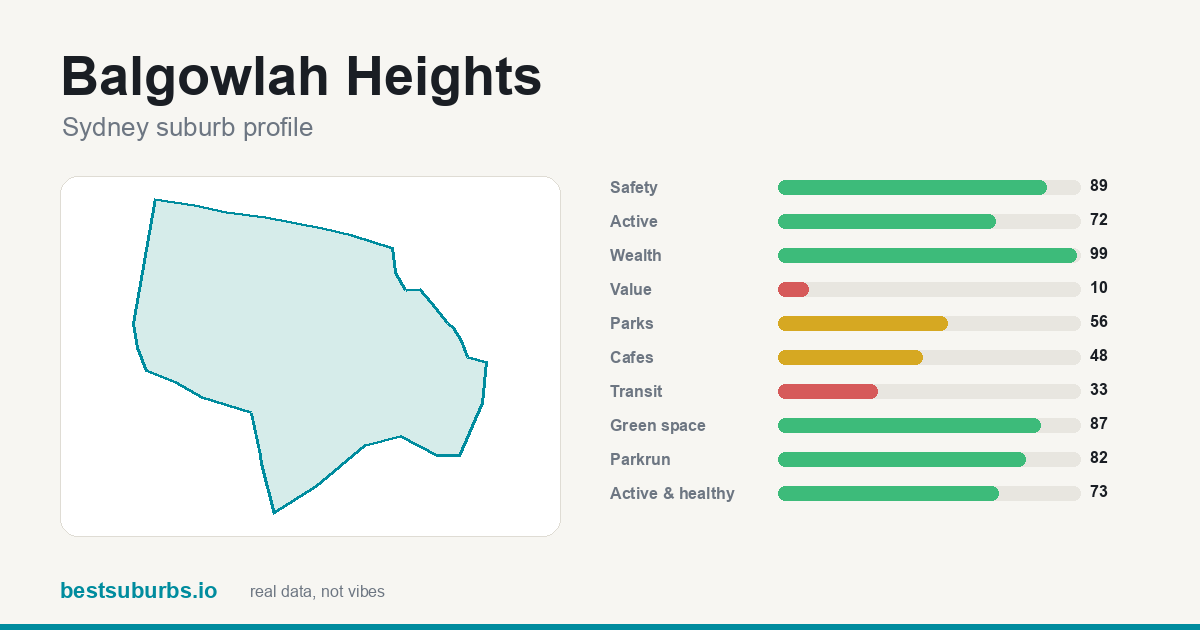 Balgowlah Heights Balgowlah Heights | 4,687 | 99 | $3,825,000 |
| 6 | 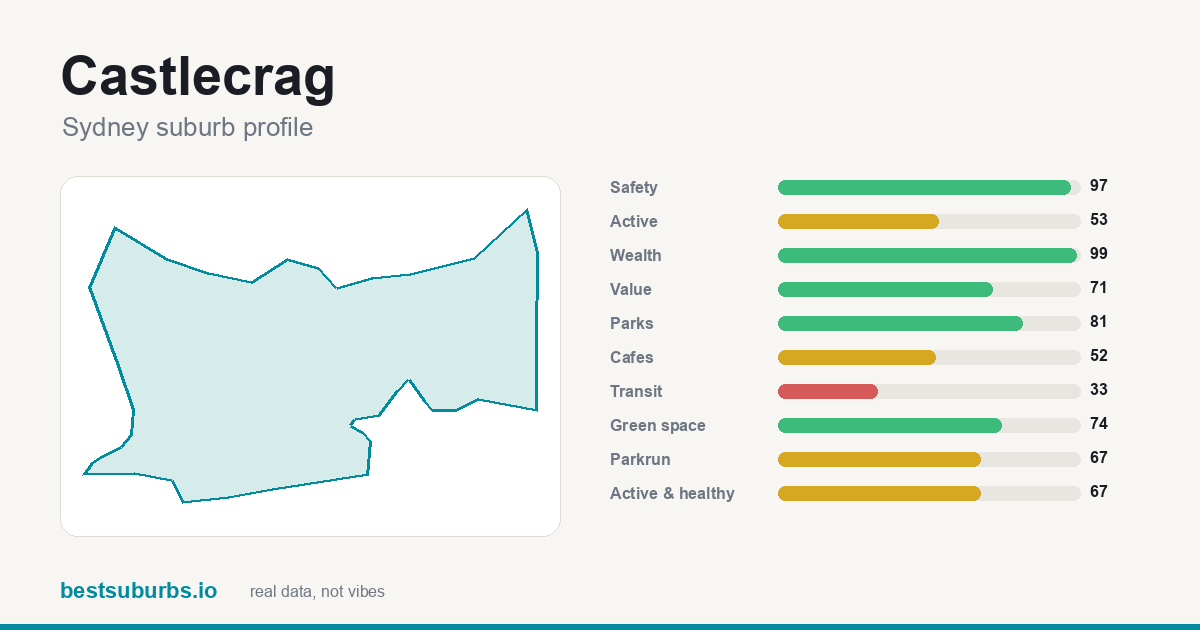 Castlecrag Castlecrag | 4,675 | 99 | $3,600,000 |
| 7 | 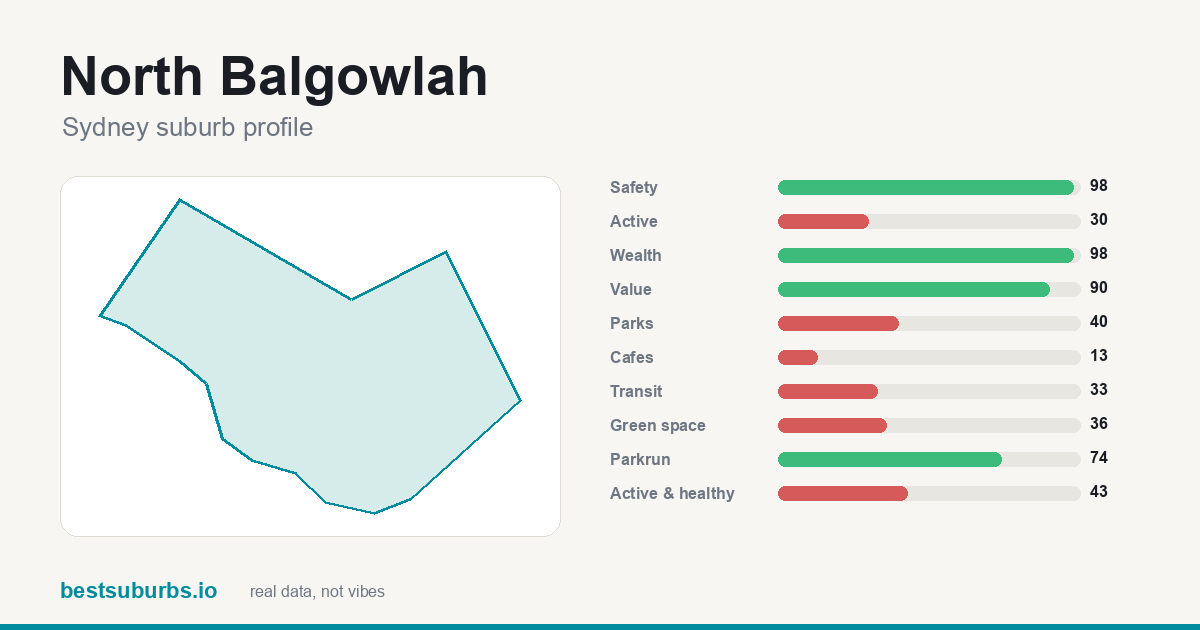 North Balgowlah North Balgowlah | 4,212 | 98 | $3,825,000 |
| 8 | 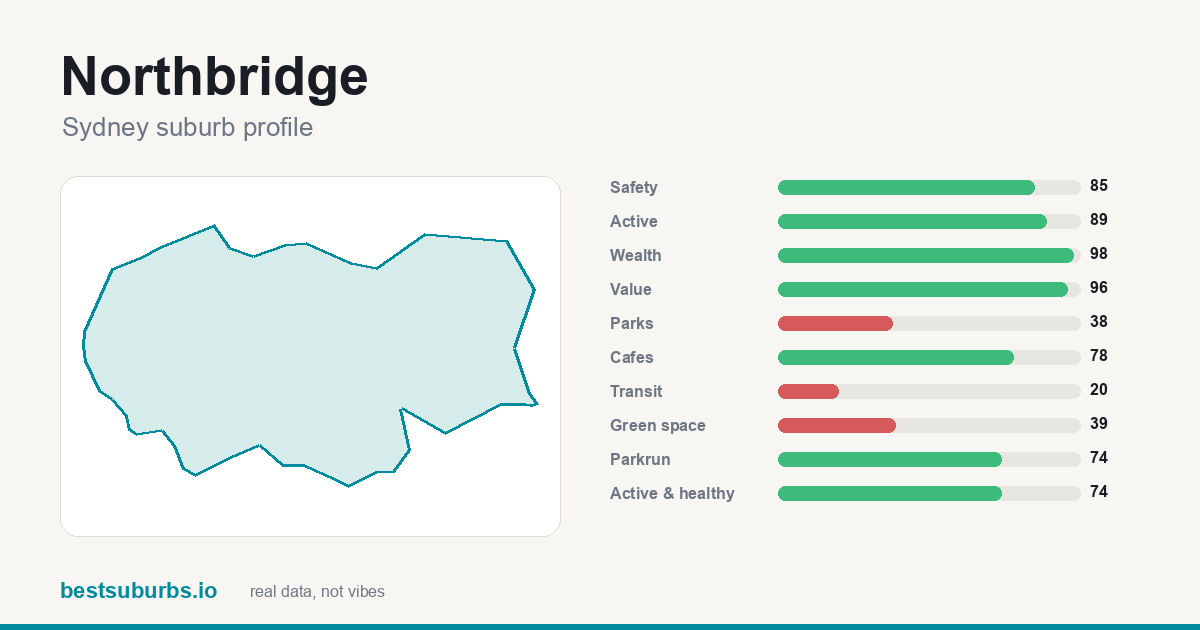 Northbridge Northbridge | 3,874 | 98 | $5,200,000 |
| 9 | 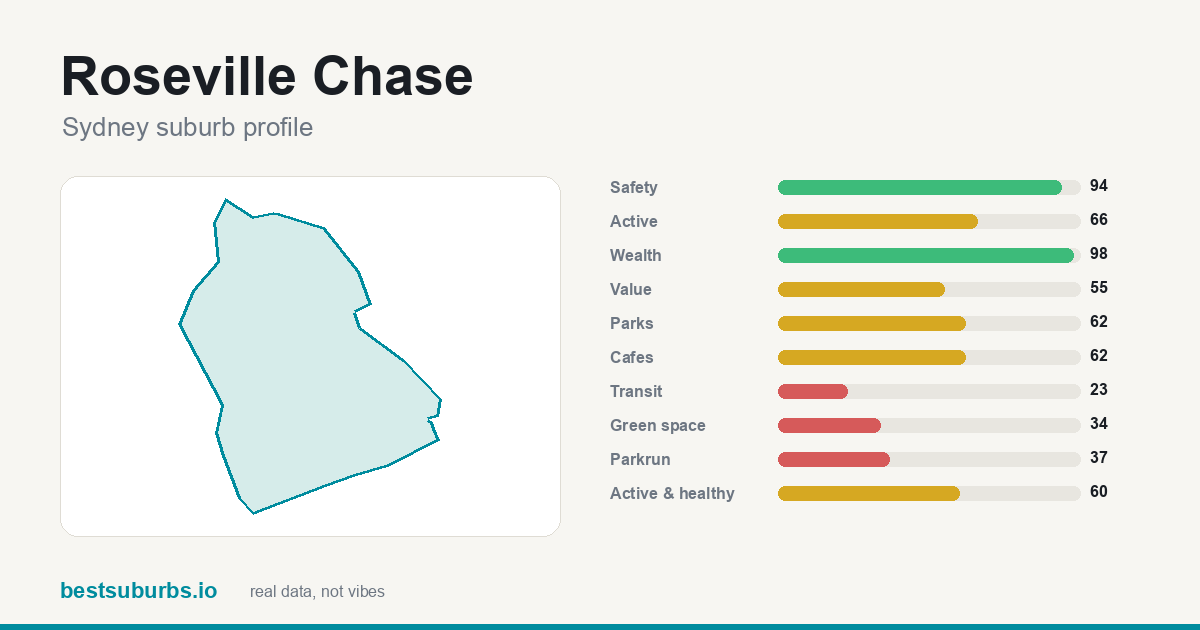 Roseville Chase Roseville Chase | 4,026 | 98 | $4,200,000 |
| 10 | 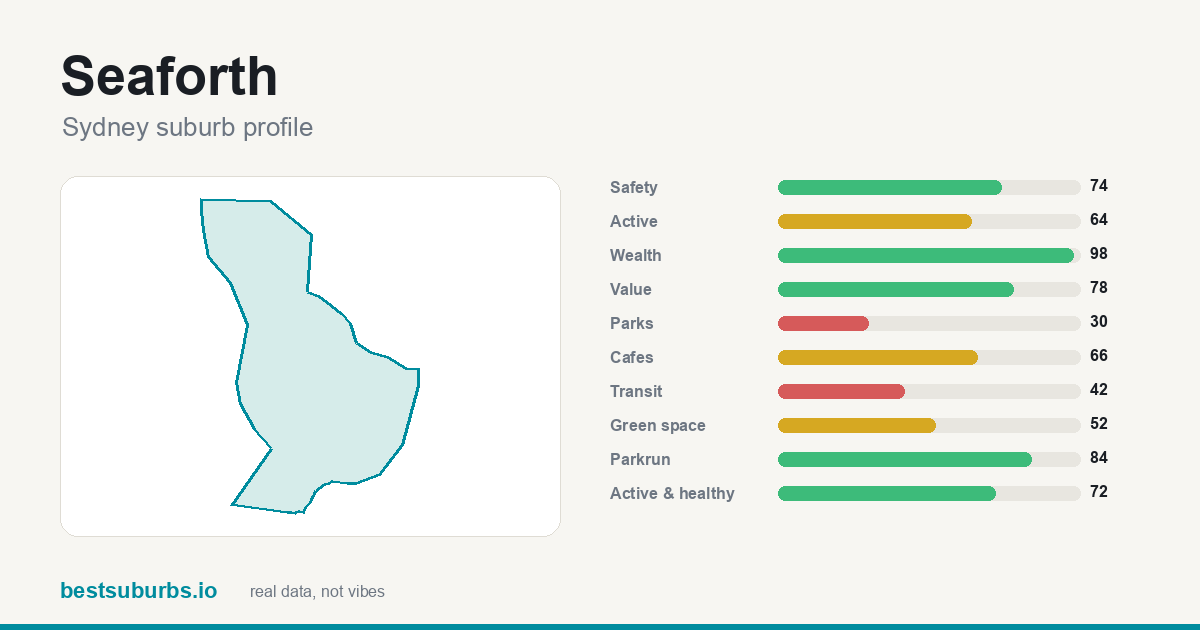 Seaforth Seaforth | 4,184 | 98 | $3,930,000 |
| 11 | 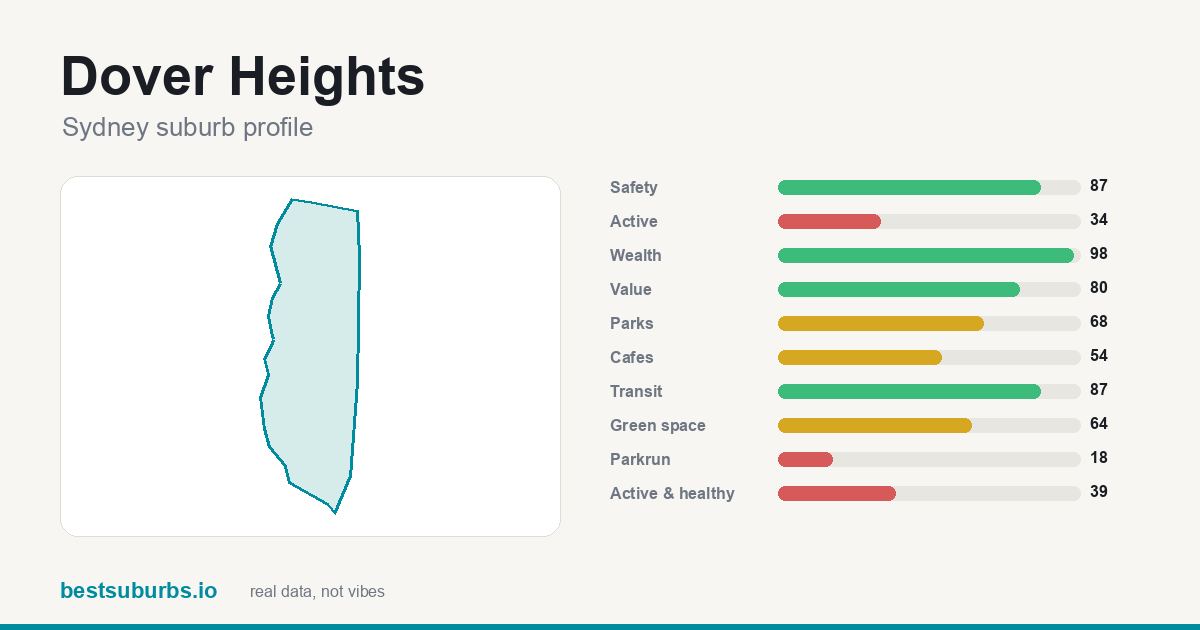 Dover Heights Dover Heights | 3,877 | 98 | $7,280,000 |
| 12 | 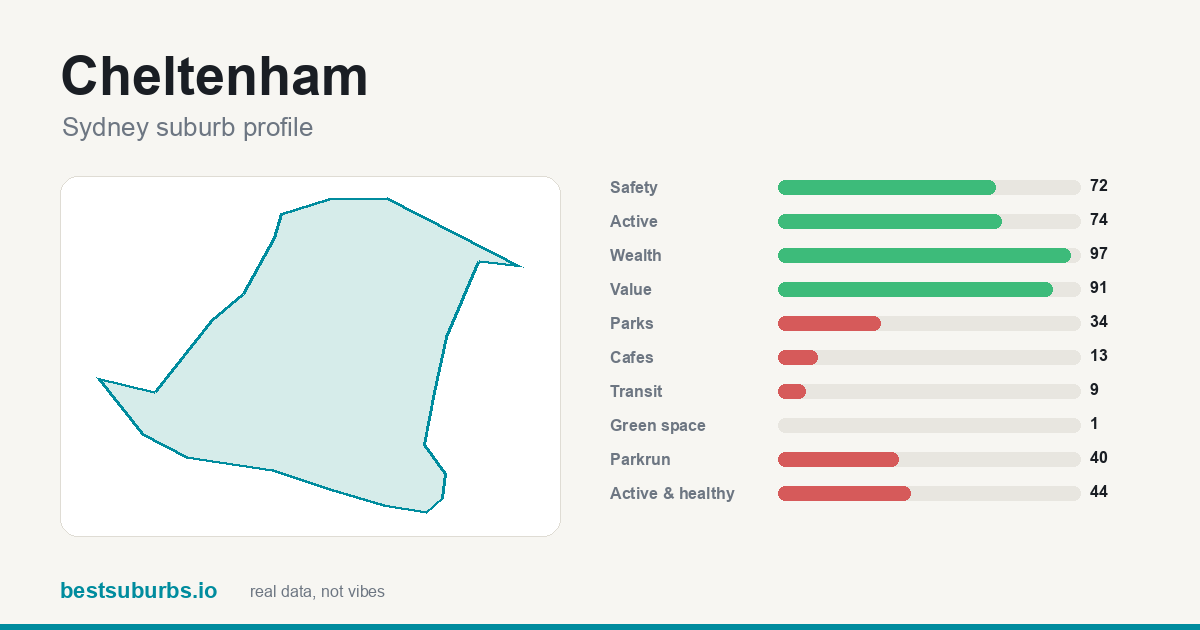 Cheltenham Cheltenham | 3,573 | 97 | $2,896,000 |
| 13 | 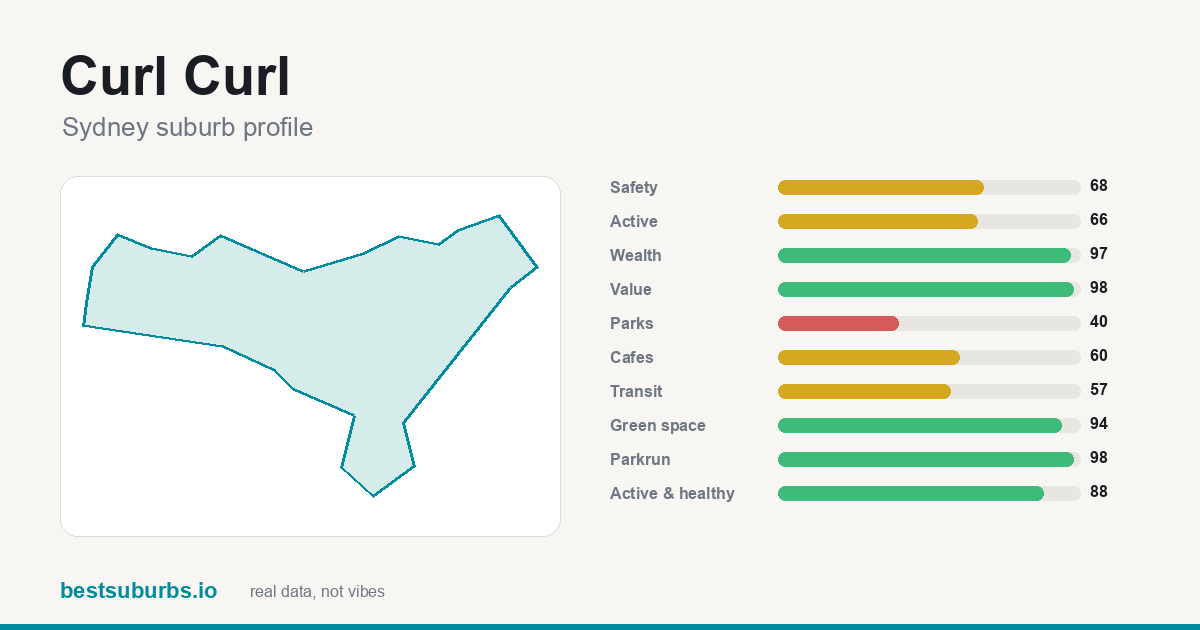 Curl Curl Curl Curl | 3,870 | 97 | $3,888,000 |
| 14 | 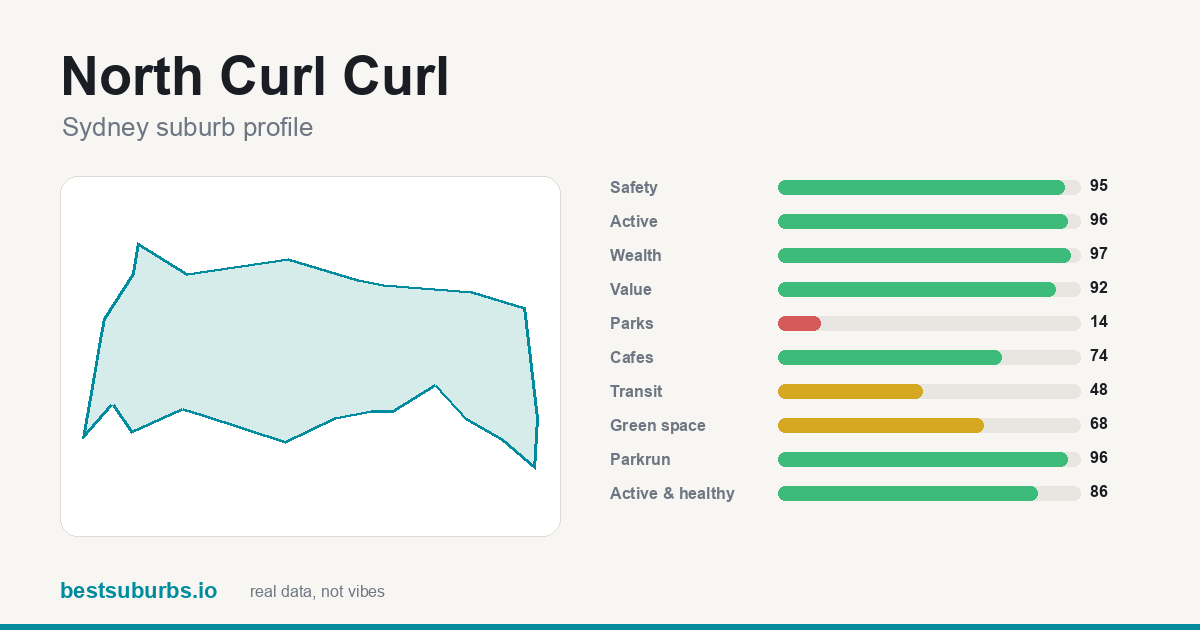 North Curl Curl North Curl Curl | 3,611 | 97 | $2,920,000 |
| 15 | 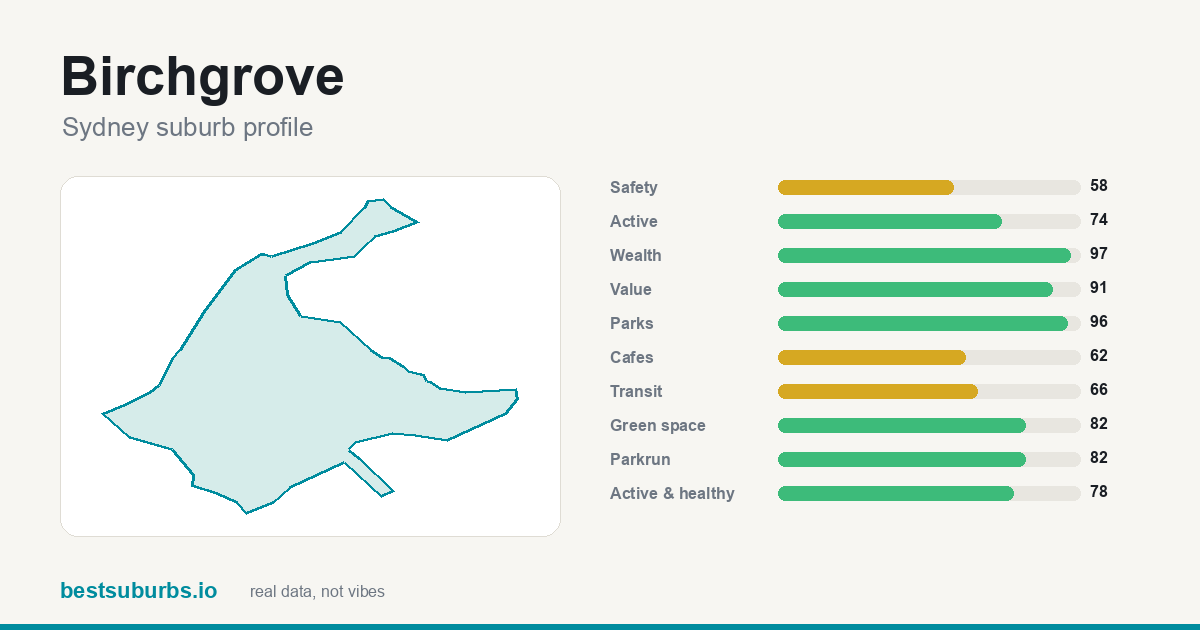 Birchgrove Birchgrove | 3,603 | 97 | $2,793,000 |
| 16 | 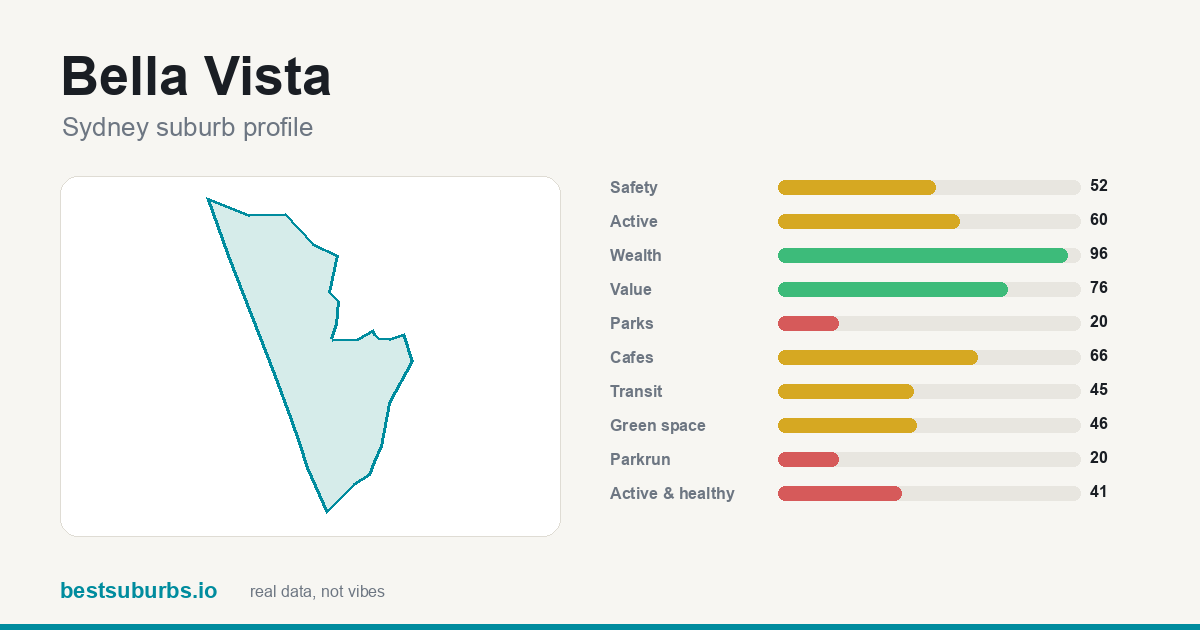 Bella Vista Bella Vista | 3,518 | 96 | $1,950,000 |
| 17 | 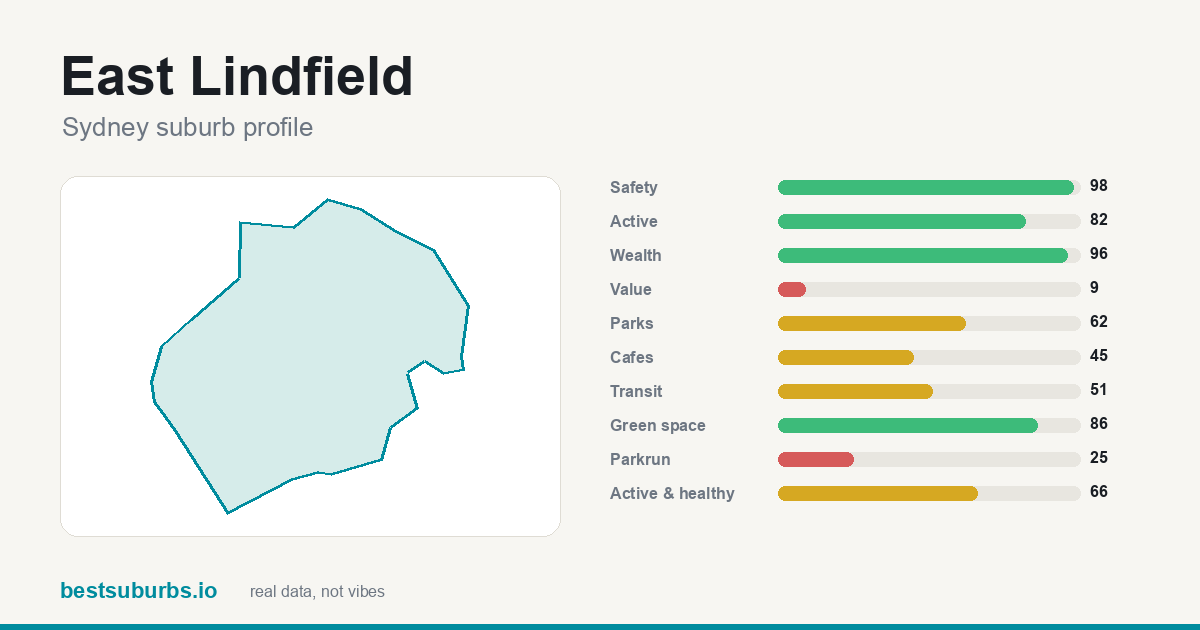 East Lindfield East Lindfield | 3,457 | 96 | $4,058,000 |
| 18 | 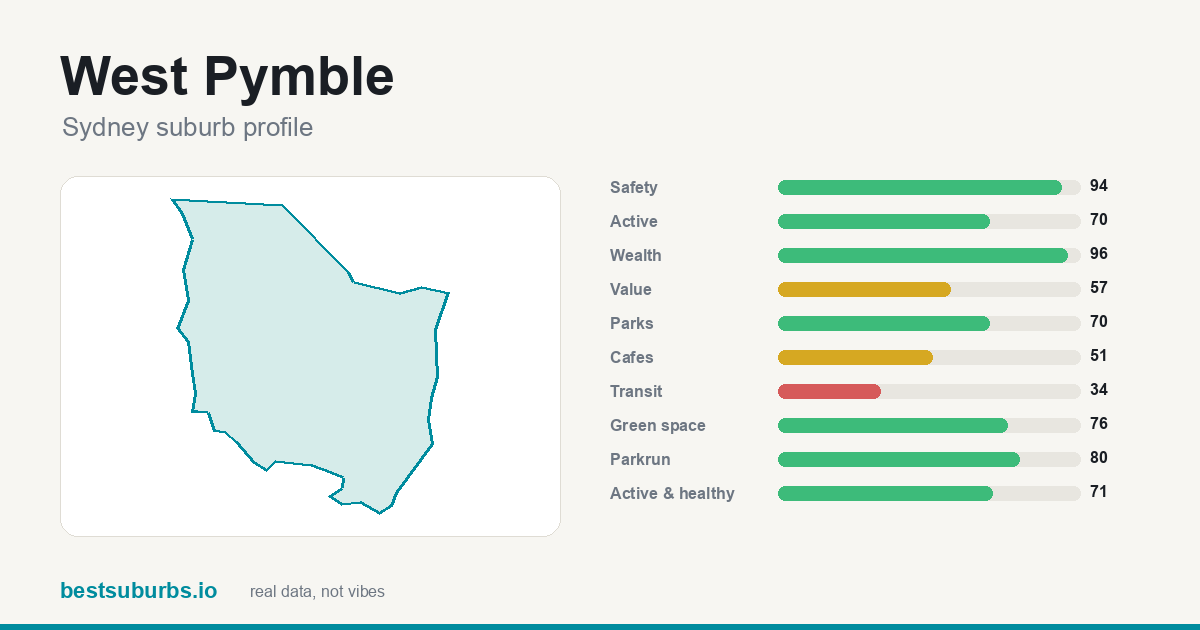 West Pymble West Pymble | 3,503 | 96 | $3,241,000 |
| 19 | 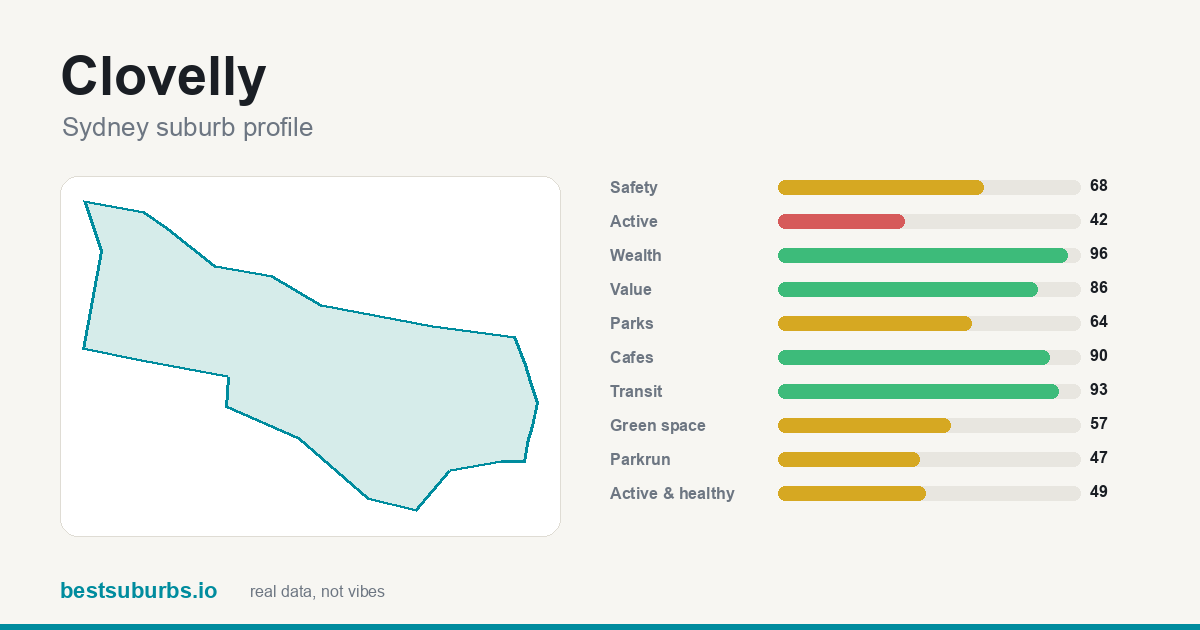 Clovelly Clovelly | 3,474 | 96 | $4,325,000 |
| 20 | 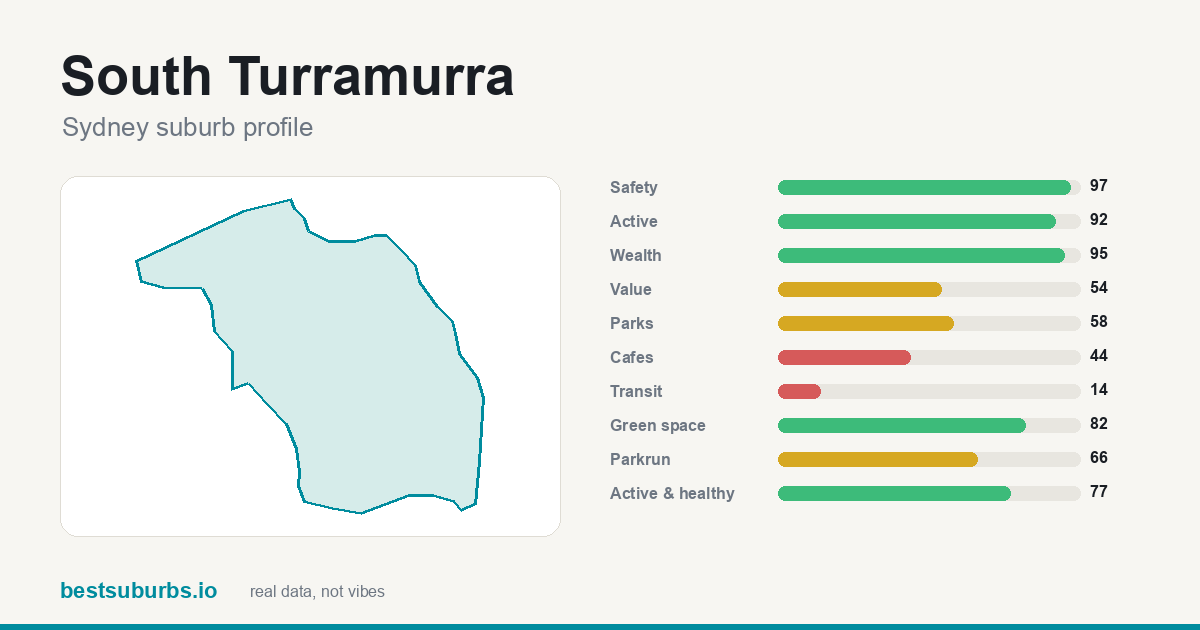 South Turramurra South Turramurra | 3,447 | 95 | $3,263,000 |
| 21 | 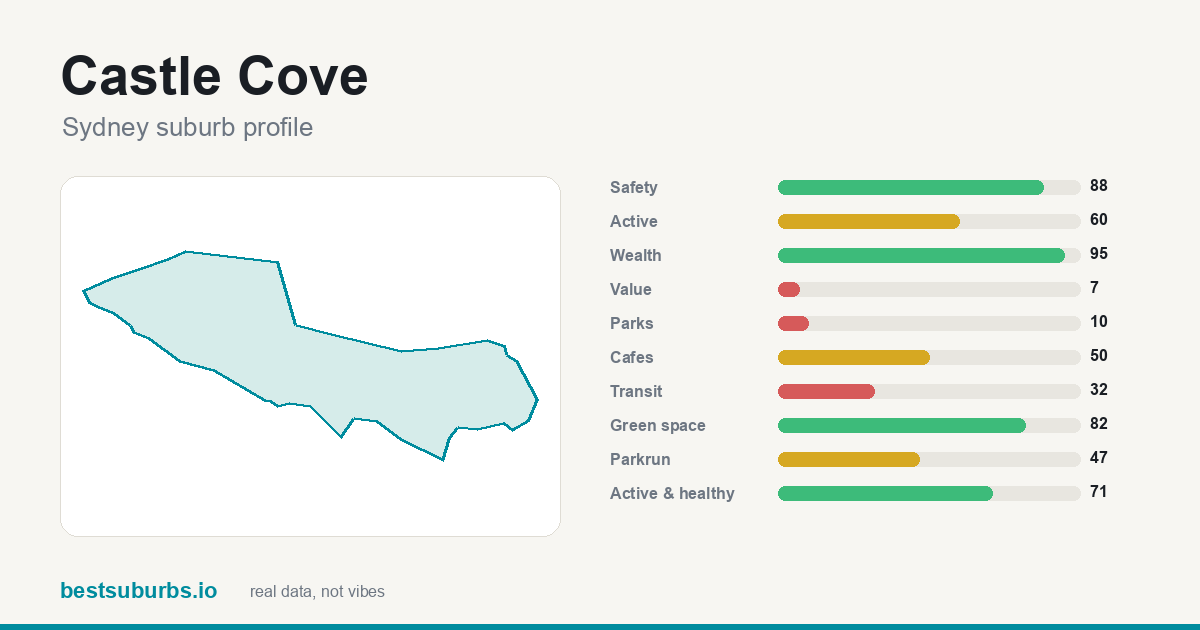 Castle Cove Castle Cove | 3,439 | 95 | $4,200,000 |
| 22 | 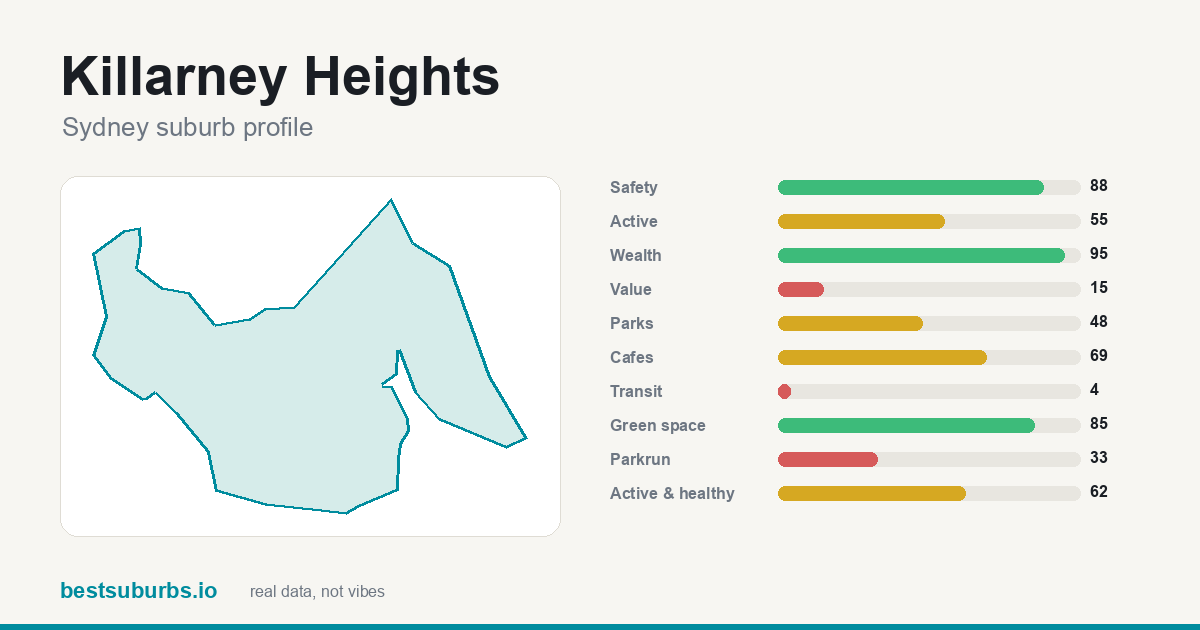 Killarney Heights Killarney Heights | 3,426 | 95 | $2,725,000 |
| 23 | 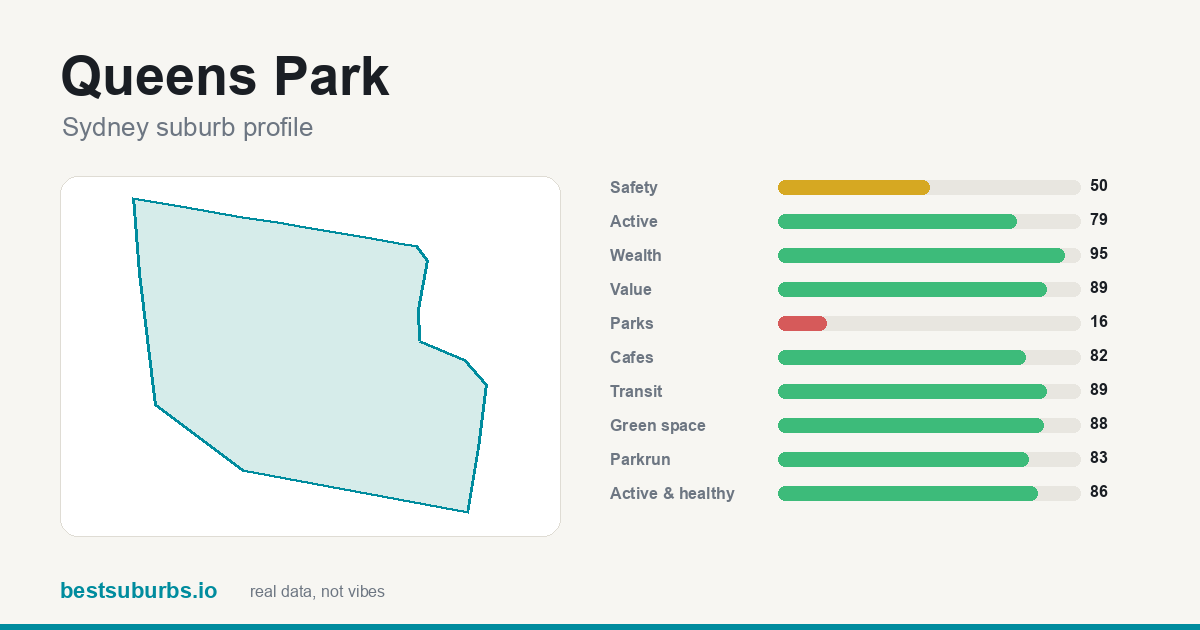 Queens Park Queens Park | 3,441 | 95 | $4,140,000 |
| 24 | 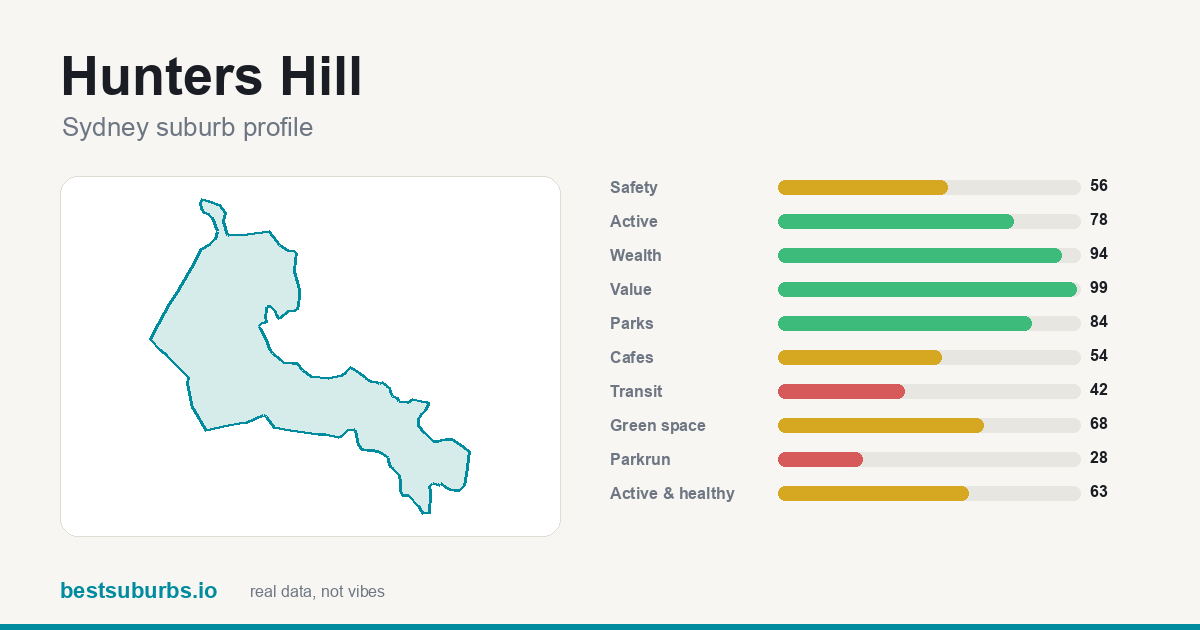 Hunters Hill Hunters Hill | 3,413 | 94 | $4,365,000 |
| 25 | 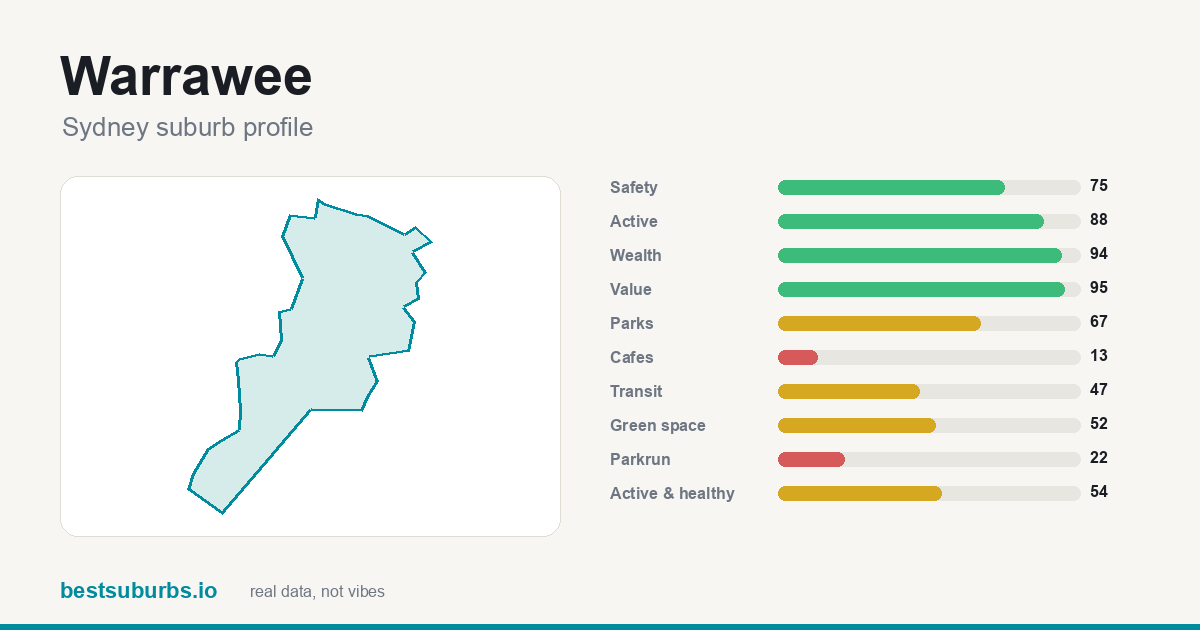 Warrawee Warrawee | 3,388 | 94 | $3,263,000 |
Showing the top 25 of 422 ranked suburbs. Scores are percentiles against every other suburb in Sydney: 100 is the best in the city, 50 is mid-table. Click any suburb for its full profile.
Why are these the 10 wealthiest suburbs in Sydney? (October 2026)
Updated 14 October 2026 · one sentence of real reasons per suburb, from the data on this page.
- Riverview ★ 100
What lifts Riverview to #1 is a recorded crime rate of about 11 offences per 1,000 residents (safety score 96/100); it also has 98% of it within 400 m of a park, and 2.8 ha of parkland per 1,000 residents.
- Longueville ★ 100
What lifts Longueville to #2 is 100% of it within 400 m of a park; it also has a recorded crime rate of about 19 offences per 1,000 residents (safety score 82/100), and 7.8 ha of parkland per 1,000 residents.
- Willoughby East ★ 99
What lifts Willoughby East to #3 is a recorded crime rate of about 5 offences per 1,000 residents (safety score 100/100); it also has 24 public transport stops inside it for a transit score of 92, and a median house price of $3.6m (Jan–Mar 2026).
- Clontarf ★ 99
Clontarf takes #4 on a recorded crime rate of about 22 offences per 1,000 residents (safety score 74/100), with 86% of it within 400 m of a park, and 2 cafés.
- Balgowlah Heights ★ 99
At #5, Balgowlah Heights combines a recorded crime rate of about 16 offences per 1,000 residents (safety score 89/100) and 99% of it within 400 m of a park, and 16.6 ha of parkland per 1,000 residents.
- Castlecrag ★ 99
Castlecrag (#6) scores on a recorded crime rate of about 10 offences per 1,000 residents (safety score 97/100) and 96% of it within 400 m of a park, and 5.0 ha of parkland per 1,000 residents.
- North Balgowlah ★ 98
#7 North Balgowlah — a recorded crime rate of about 8 offences per 1,000 residents (safety score 98/100), plus 86% of it within 400 m of a park, and 1 government primary school inside the suburb.
- Northbridge ★ 98
Northbridge takes #8 on a recorded crime rate of about 18 offences per 1,000 residents (safety score 85/100), with 74% of it within 400 m of a park, and 1 government primary school inside the suburb.
- Roseville Chase ★ 98
Roseville Chase ranks #9: a recorded crime rate of about 12 offences per 1,000 residents (safety score 94/100), 82% of it within 400 m of a park, and a median house price of $4.2m (Jan–Mar 2026).
- Seaforth ★ 98
Seaforth (#10) scores on a recorded crime rate of about 22 offences per 1,000 residents (safety score 74/100) and 75% of it within 400 m of a park, and 1 government primary school inside the suburb.
Why each of the top 10 wealthiest suburbs in Sydney ranks where it does
Written from this page's own data: each figure below is the suburb's own value, set against the Sydney median where we hold one.
1. Riverview
Riverview is #1 of 422 ranked Sydney suburbs on this list, with a score of 100/100. Median household income is $4,731 a week, against a Sydney median of $2,276 (census). The trade-off: it scores 13/100 for cafés, so it is weaker there. It covers 1.4 km² with about 3,148 residents (census).
2. Longueville
Longueville is #2 of 422 ranked Sydney suburbs on this list, with a score of 100/100. Median household income is $4,894 a week, against a Sydney median of $2,276 (census). The trade-off: it scores 13/100 for cafés, so it is weaker there. It covers 1 km² with about 2,116 residents (census).
3. Willoughby East
Willoughby East is #3 of 422 ranked Sydney suburbs on this list, with a score of 99/100. Median household income is $4,536 a week, against a Sydney median of $2,276 (census). The trade-off: it scores 13/100 for cafés, so it is weaker there. It covers 0.6 km² with about 1,864 residents (census).
4. Clontarf
Clontarf is #4 of 422 ranked Sydney suburbs on this list, with a score of 99/100. Median household income is $4,609 a week, against a Sydney median of $2,276 (census). The trade-off: it scores 8/100 for parks, so it is weaker there. It covers 0.9 km² with about 1,746 residents (census).
5. Balgowlah Heights
Balgowlah Heights is #5 of 422 ranked Sydney suburbs on this list, with a score of 99/100. Median household income is $4,687 a week, against a Sydney median of $2,276 (census). The trade-off: it scores 10/100 for value for rent, so it is weaker there. It covers 1.6 km² with about 3,546 residents (census).
6. Castlecrag
Castlecrag is #6 of 422 ranked Sydney suburbs on this list, with a score of 99/100. Median household income is $4,675 a week, against a Sydney median of $2,276 (census). The trade-off: it scores 25/100 for public transport, so it is weaker there. It covers 1.5 km² with about 2,965 residents (census).
7. North Balgowlah
North Balgowlah is #7 of 422 ranked Sydney suburbs on this list, with a score of 98/100. Median household income is $4,212 a week, against a Sydney median of $2,276 (census). The trade-off: it scores 13/100 for cafés, so it is weaker there. It covers 1 km² with about 3,816 residents (census).
8. Northbridge
Northbridge is #8 of 422 ranked Sydney suburbs on this list, with a score of 98/100. Median household income is $3,874 a week, against a Sydney median of $2,276 (census). The trade-off: it scores 20/100 for public transport, so it is weaker there. It covers 2.7 km² with about 6,493 residents (census).
9. Roseville Chase
Roseville Chase is #9 of 422 ranked Sydney suburbs on this list, with a score of 98/100. Median household income is $4,026 a week, against a Sydney median of $2,276 (census). The trade-off: it scores 23/100 for public transport, so it is weaker there. It covers 1.3 km² with about 1,618 residents (census).
10. Seaforth
Seaforth is #10 of 422 ranked Sydney suburbs on this list, with a score of 98/100. Median household income is $4,184 a week, against a Sydney median of $2,276 (census). The trade-off: it scores 30/100 for parks, so it is weaker there. It covers 3.1 km² with about 7,384 residents (census).
How do these suburbs compare head to head?
What else do people ask about wealthiest suburbs in Sydney?
What are the wealthiest suburbs in Sydney?
On our October 2026 data the top five are Riverview (100/100), Longueville (100/100), Willoughby East (99/100), Clontarf (99/100), Balgowlah Heights (99/100), out of 422 ranked Sydney suburbs.
How is this ranking calculated?
Median weekly household income from the census, as a percentile. This is a factual ranking, not a recommendation — high income does not make a suburb a good place for you to live, and several of our other lists disagree with this one on purpose. 422 of 422 Sydney suburbs had enough data to be ranked. Updated October 2026.
Is this ranking sponsored?
No. No ranking on this site is sold or sponsored. It is computed from open data: GPS activity traces, official crime statistics, the ABS census and OpenStreetMap.
What other Sydney rankings are there?
Sources: open GPS activity traces, official crime statistics, ABS census,
OpenStreetMap (ODbL). Sale prices: NSW DCJ Rent and Sales Report, January - March 2026 quarter — © State of New South Wales (Department of Communities and Justice), Rent and Sales Report, CC BY 4.0; suburb-to-postcode mapping © GeoNames.org, CC BY 4.0. NSW publishes no free suburb-level sale medians, so this is the median for the suburb's POSTCODE (non-strata sales = houses, strata = units), which can span several suburbs. Low-volume figures rest on 30 or fewer sales in the quarter; postcodes with 10 or fewer sales are withheld by DCJ. No ranking on this site is sold or sponsored.
← all 422 Sydney suburbs, with sliders