Best suburbs in Sydney for families
Safety, schools, parks per resident, kinders and childcare, house prices for the size and transit — weighted, and shown.
Cammeray (82/100), Bonnet Bay (81/100), Peakhurst Heights (81/100) lead this ranking of 422 Sydney suburbs.
By BestSuburbs research · Updated October 2026
Part of Sydney suburb rankings · all Sydney lists
Which Sydney suburbs are best for families?
How do the top 25 compare, measure by measure?
| # | Suburb | Families score | Safety | Schools (govt data) | Green space | Transit | Median house price |
|---|---|---|---|---|---|---|---|
| 1 | 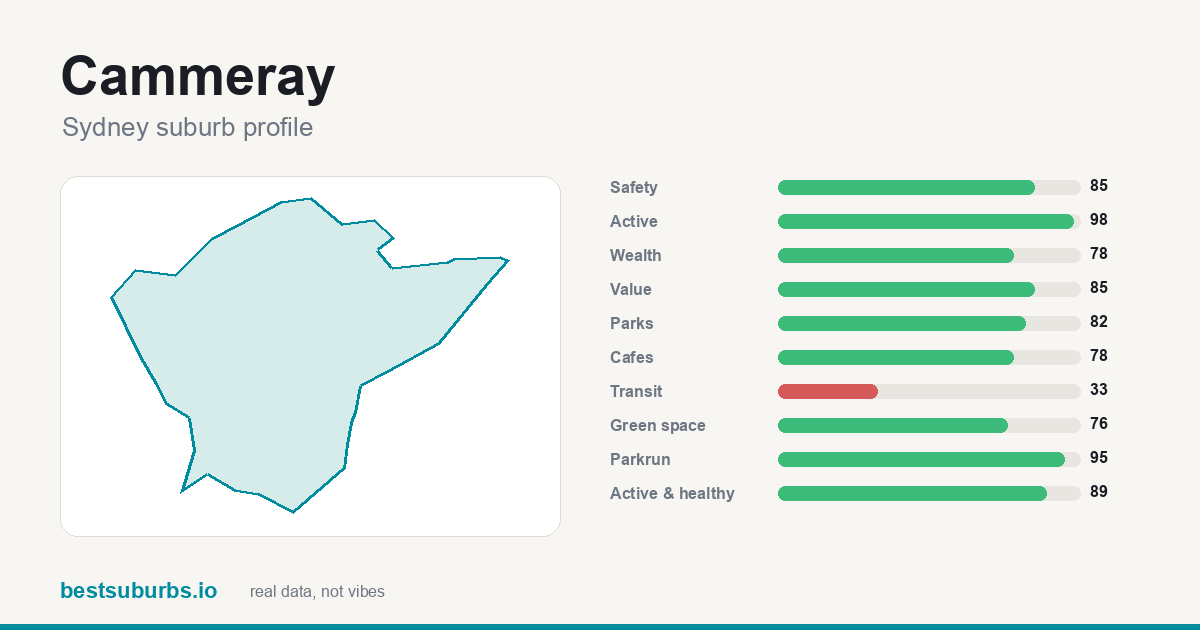 Cammeray Cammeray | 82 | 85 | 2 | 76 | 40 | — |
| 2 | 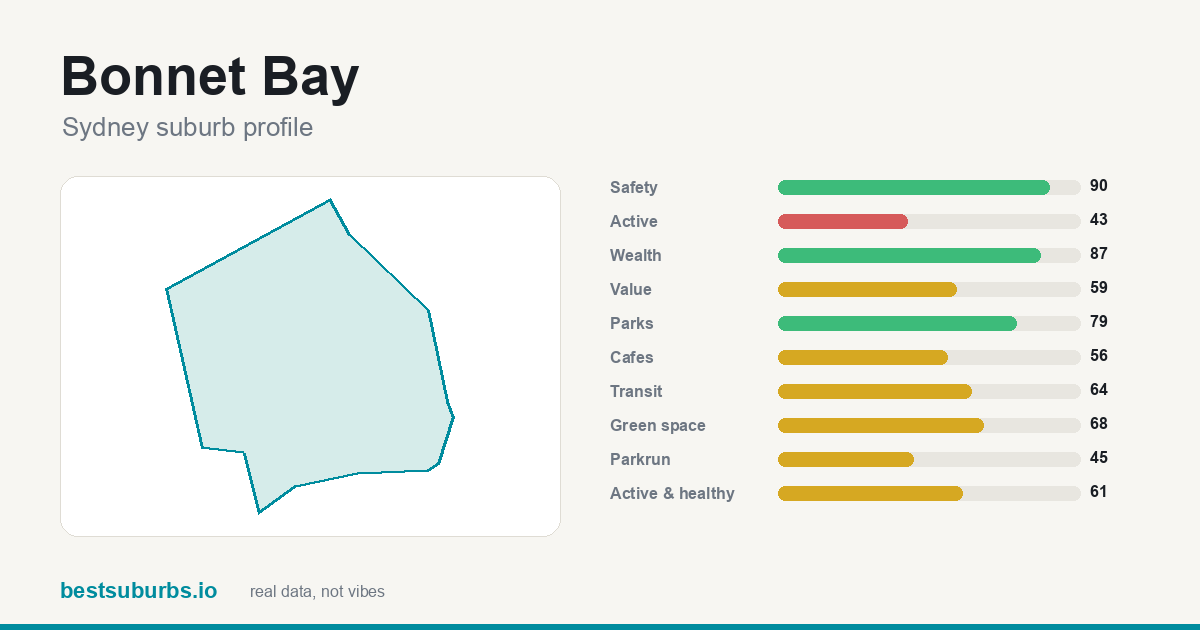 Bonnet Bay Bonnet Bay | 81 | 90 | 1 | 68 | 64 | $1,818,000 |
| 3 | 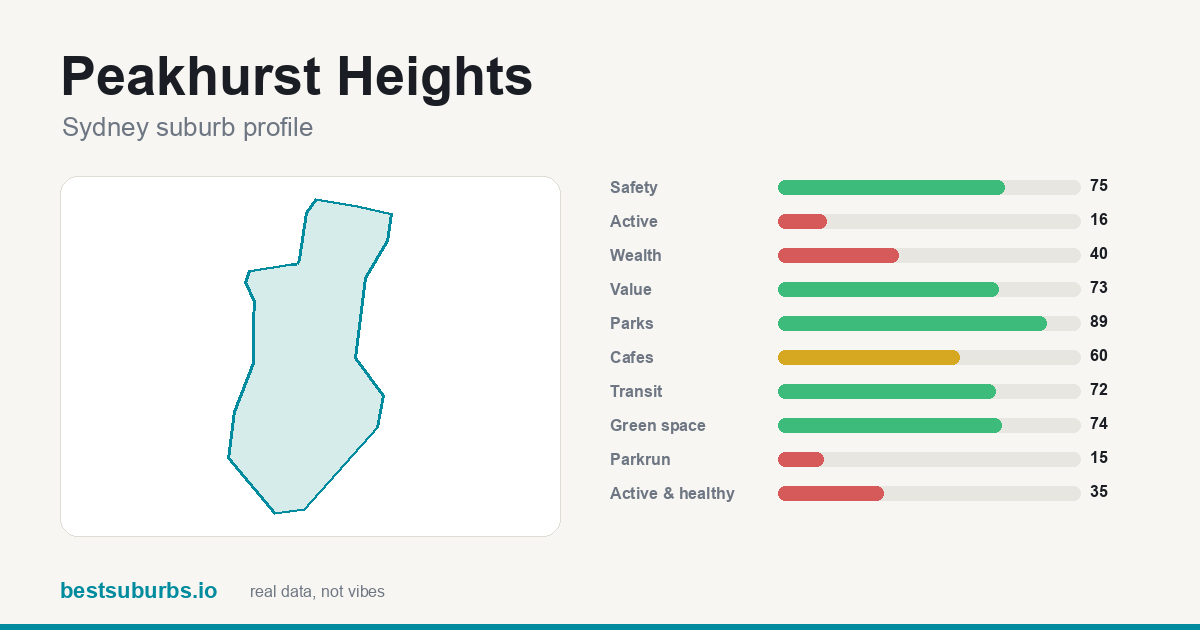 Peakhurst Heights Peakhurst Heights | 81 | 75 | 1 | 74 | 72 | $1,650,000 |
| 4 | 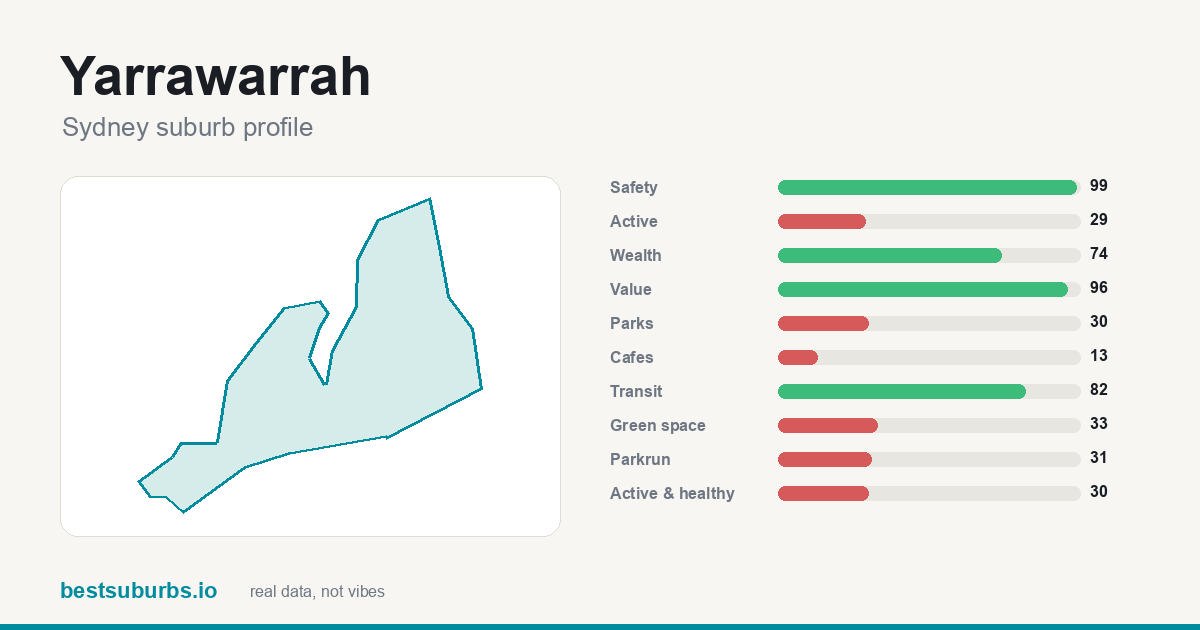 Yarrawarrah Yarrawarrah | 79 | 99 | 1 | 33 | 82 | $1,600,000 |
| 5 | 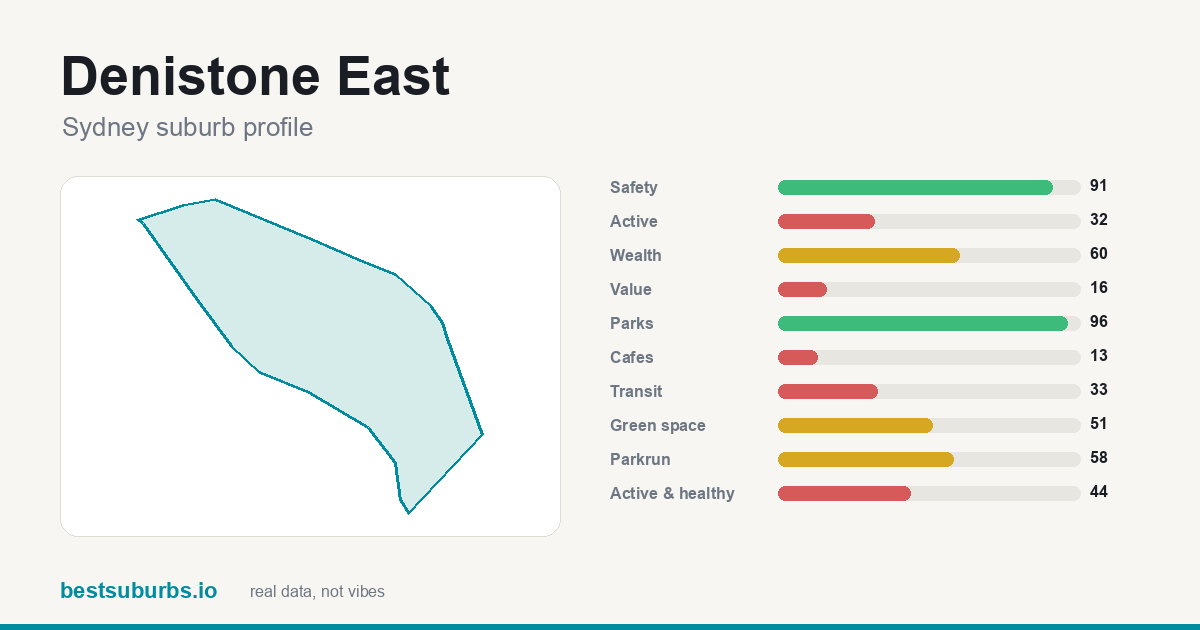 Denistone East Denistone East | 79 | 91 | 1 | 51 | 88 | $2,853,000 |
| 6 | 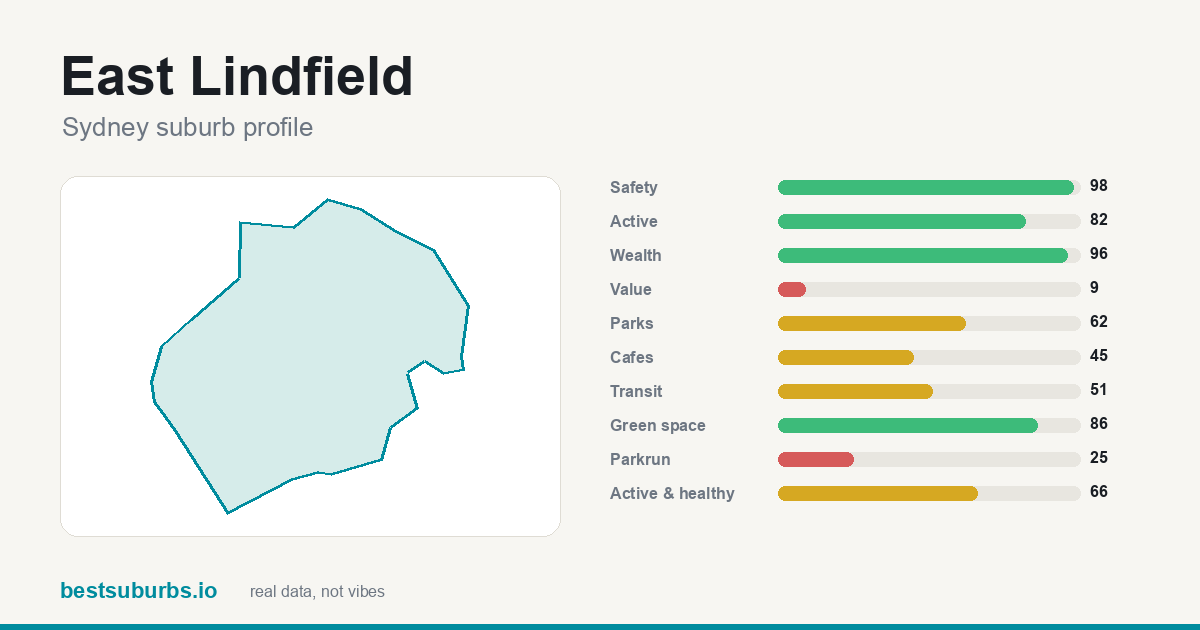 East Lindfield East Lindfield | 78 | 98 | 1 | 86 | 51 | $4,058,000 |
| 7 | 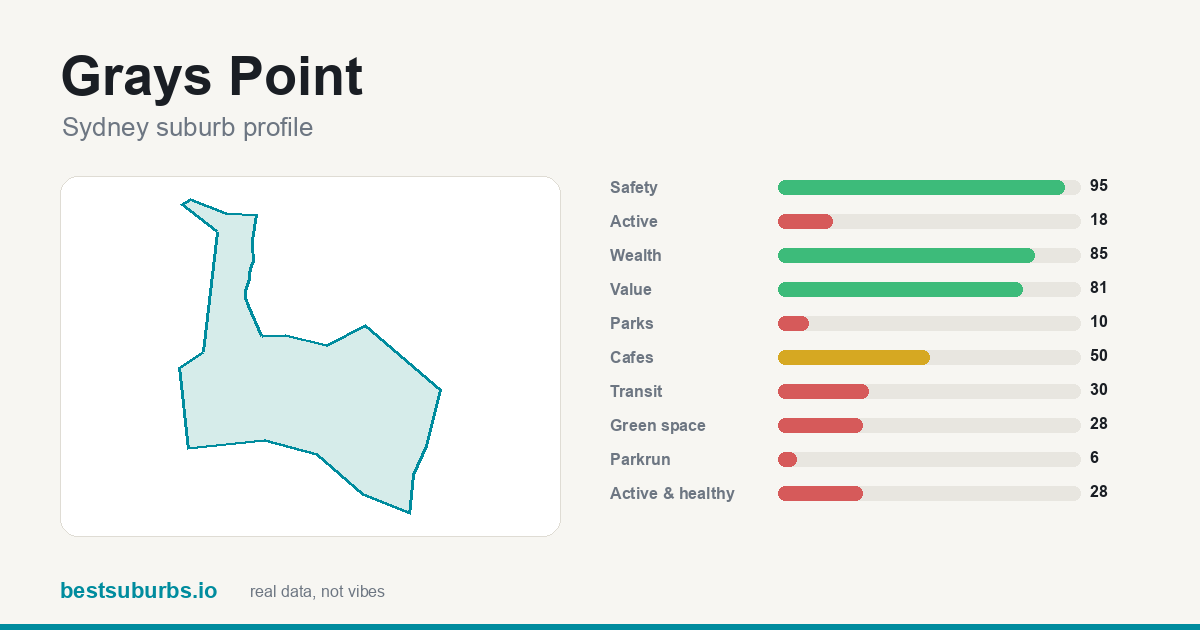 Grays Point Grays Point | 77 | 95 | 1 | 28 | 30 | $1,725,000 |
| 8 | 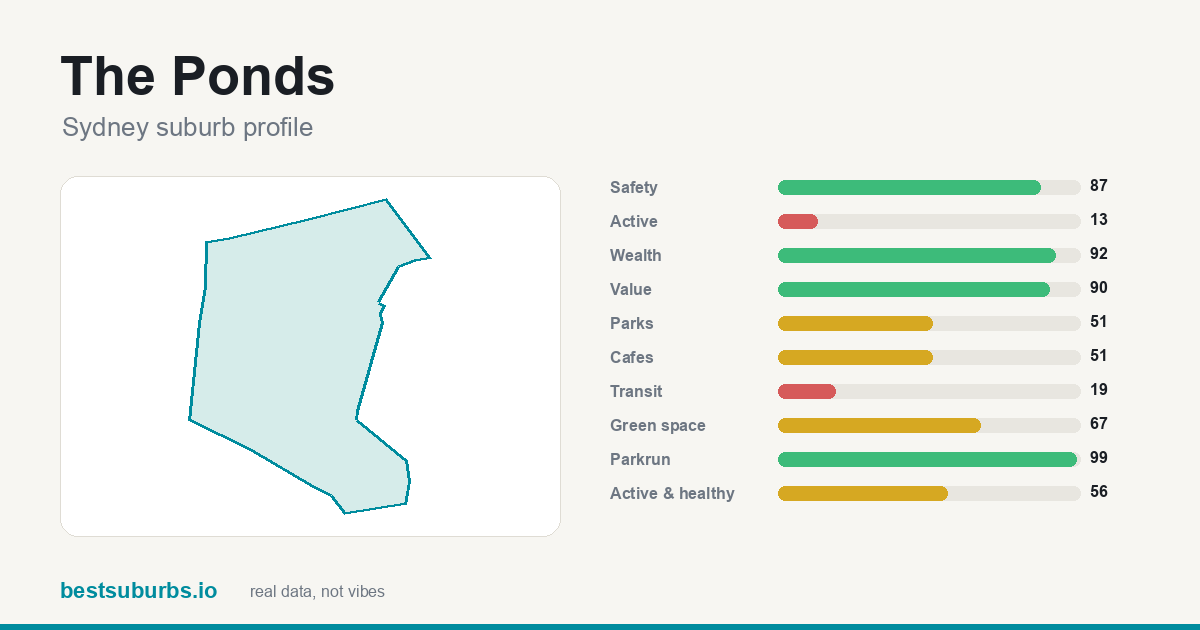 The Ponds The Ponds | 77 | 87 | 4 | 67 | 19 | $1,591,000 |
| 9 | 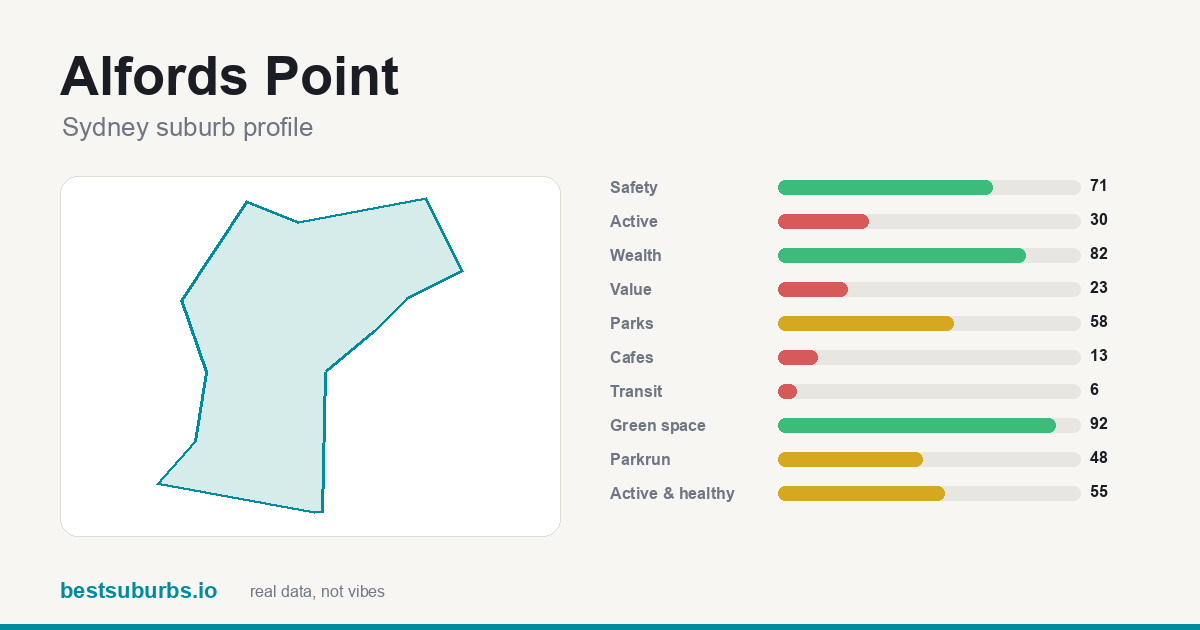 Alfords Point Alfords Point | 76 | 71 | 1 | 92 | 6 | $1,880,000 |
| 10 | 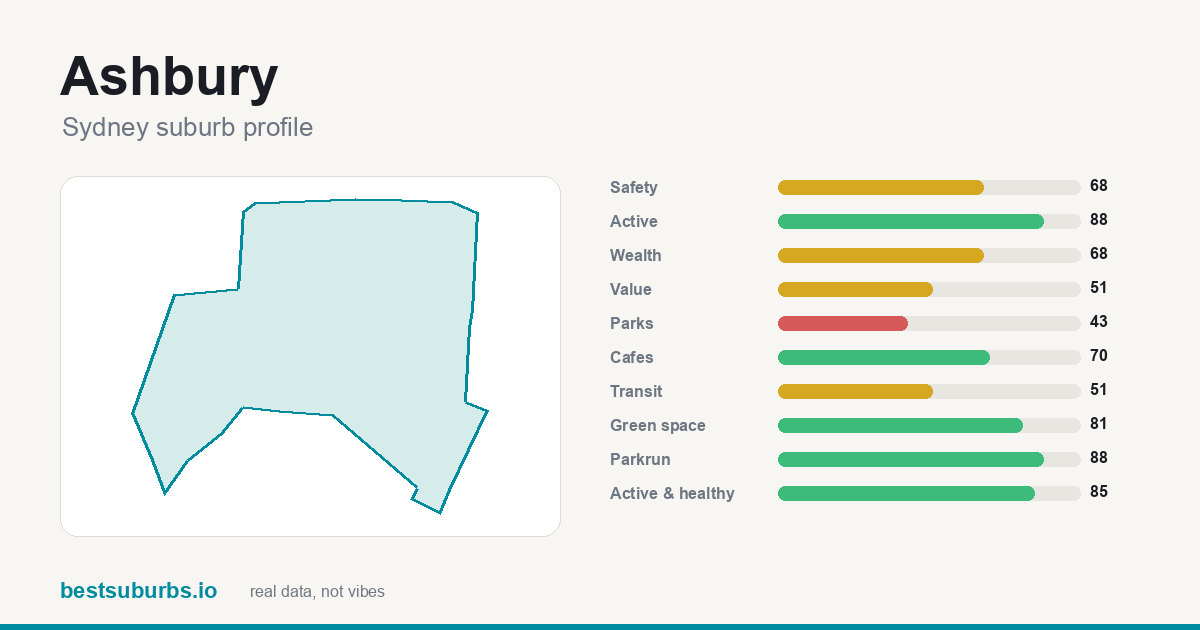 Ashbury Ashbury | 76 | 68 | 2 | 81 | 51 | $2,335,000 |
| 11 | 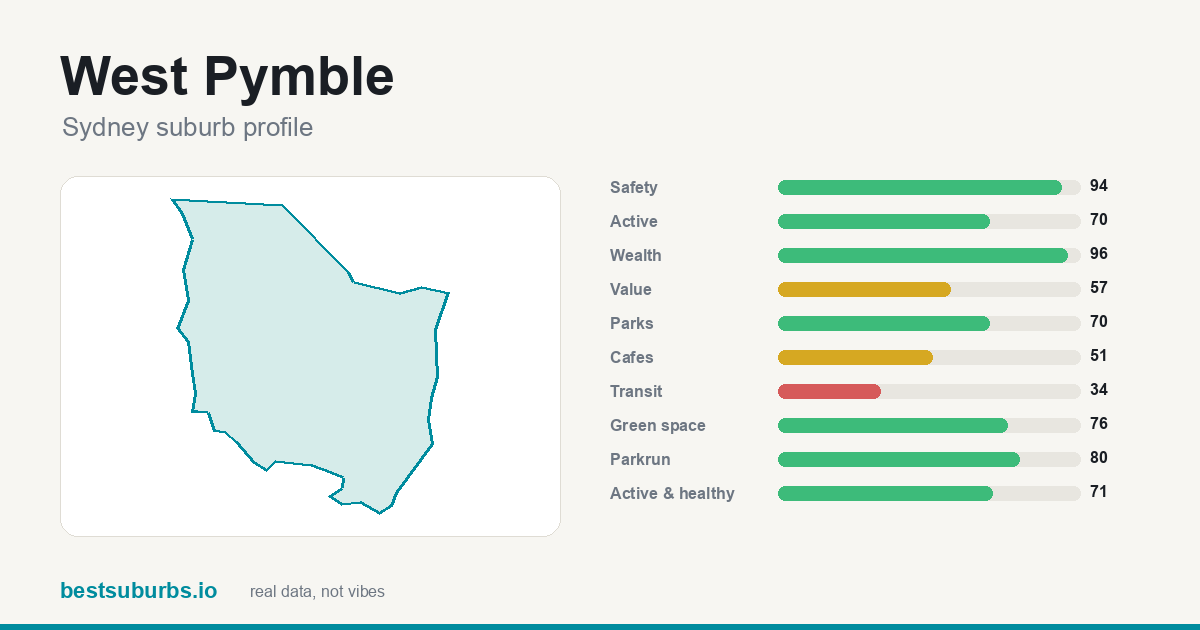 West Pymble West Pymble | 76 | 94 | 2 | 76 | 34 | $3,241,000 |
| 12 | 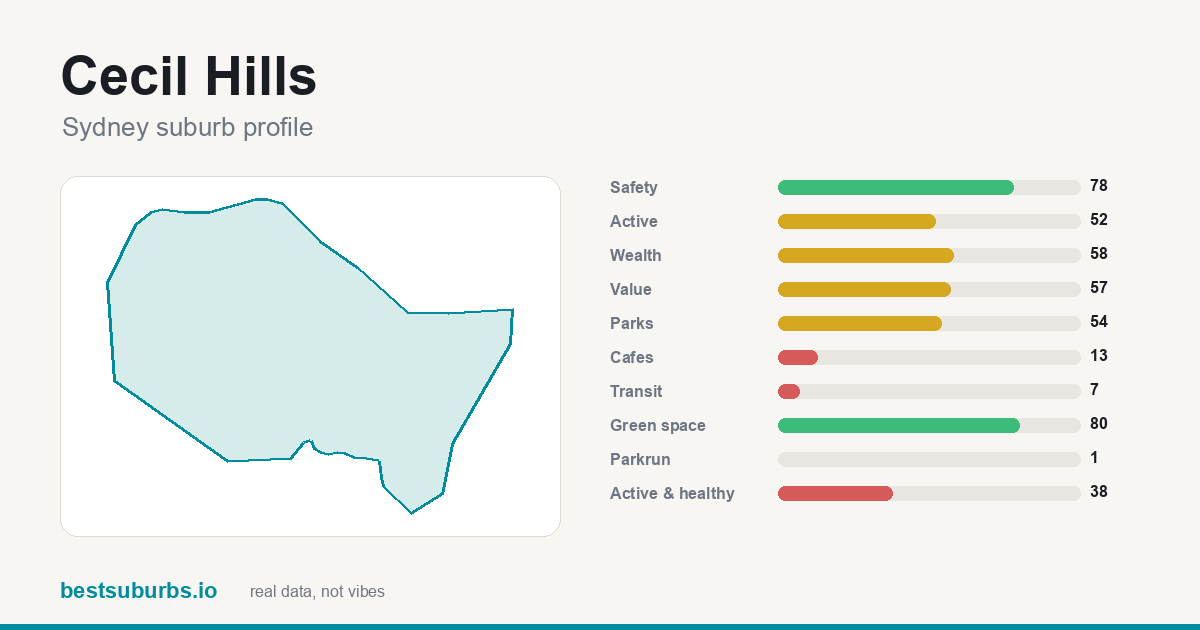 Cecil Hills Cecil Hills | 75 | 78 | 2 | 80 | 7 | $1,335,000 |
| 13 | 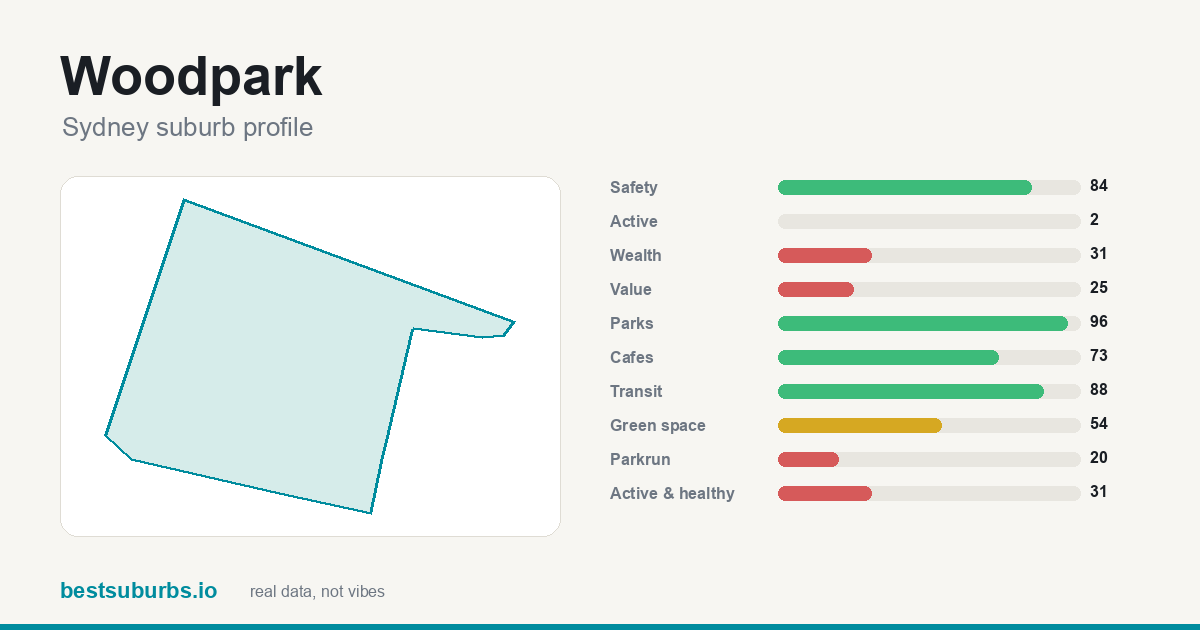 Woodpark Woodpark | 75 | 84 | 0 | 54 | 88 | $1,415,000 |
| 14 | 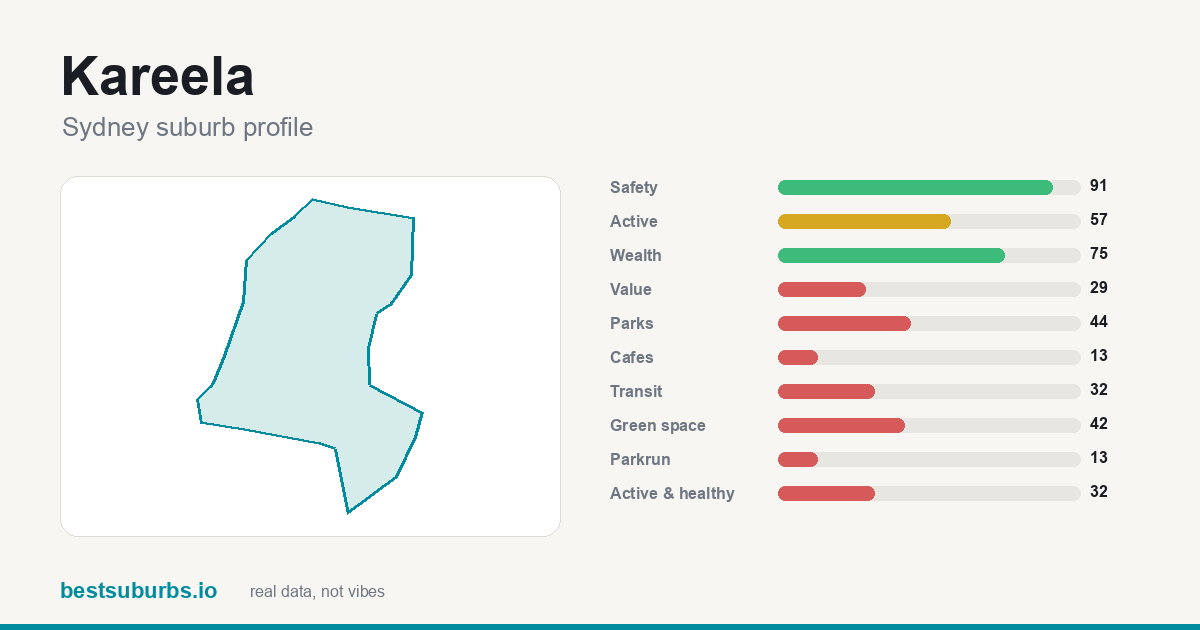 Kareela Kareela | 74 | 91 | 2 | 42 | 32 | $1,725,000 |
| 15 | 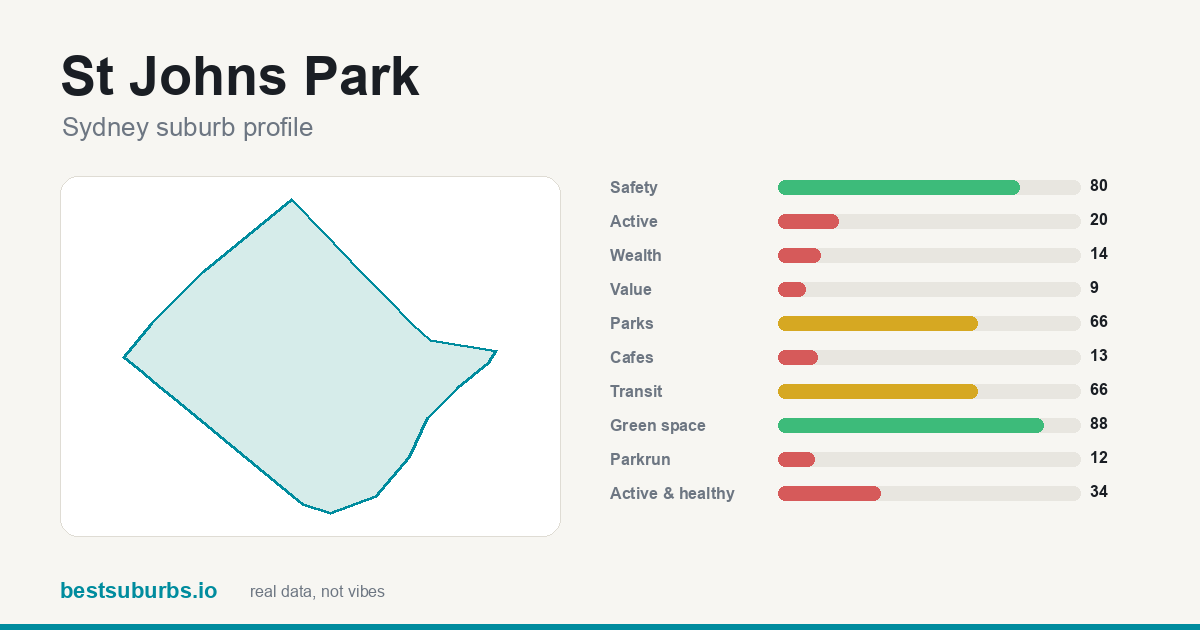 St Johns Park St Johns Park | 74 | 80 | 1 | 88 | 66 | $1,525,000 |
| 16 | 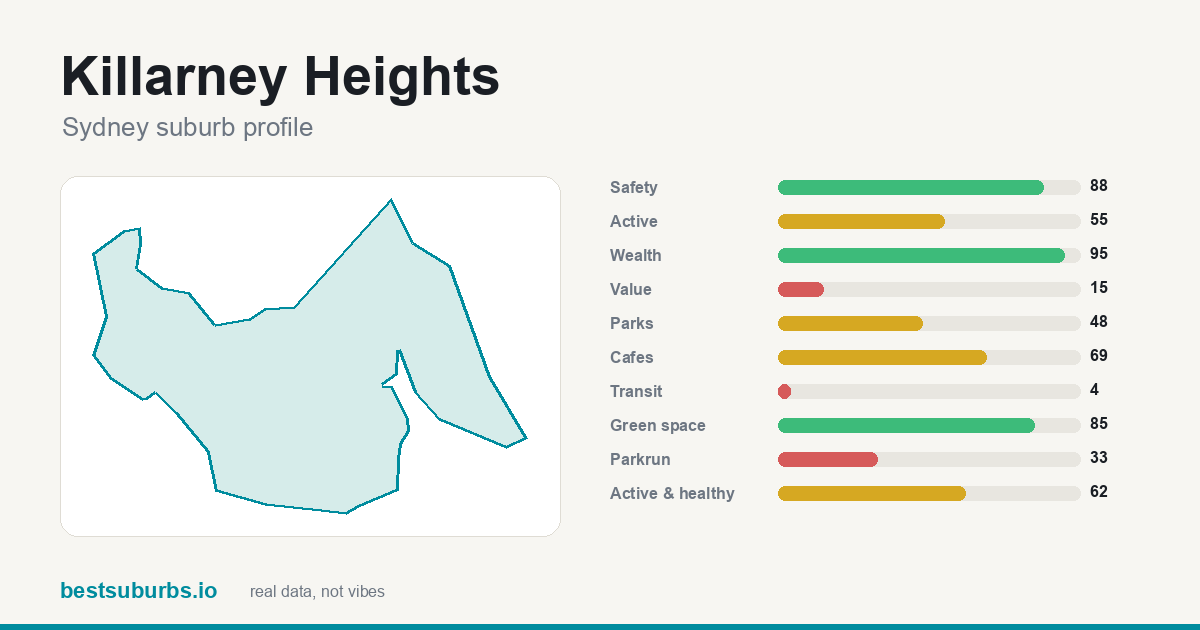 Killarney Heights Killarney Heights | 74 | 88 | 2 | 85 | 4 | $2,725,000 |
| 17 | 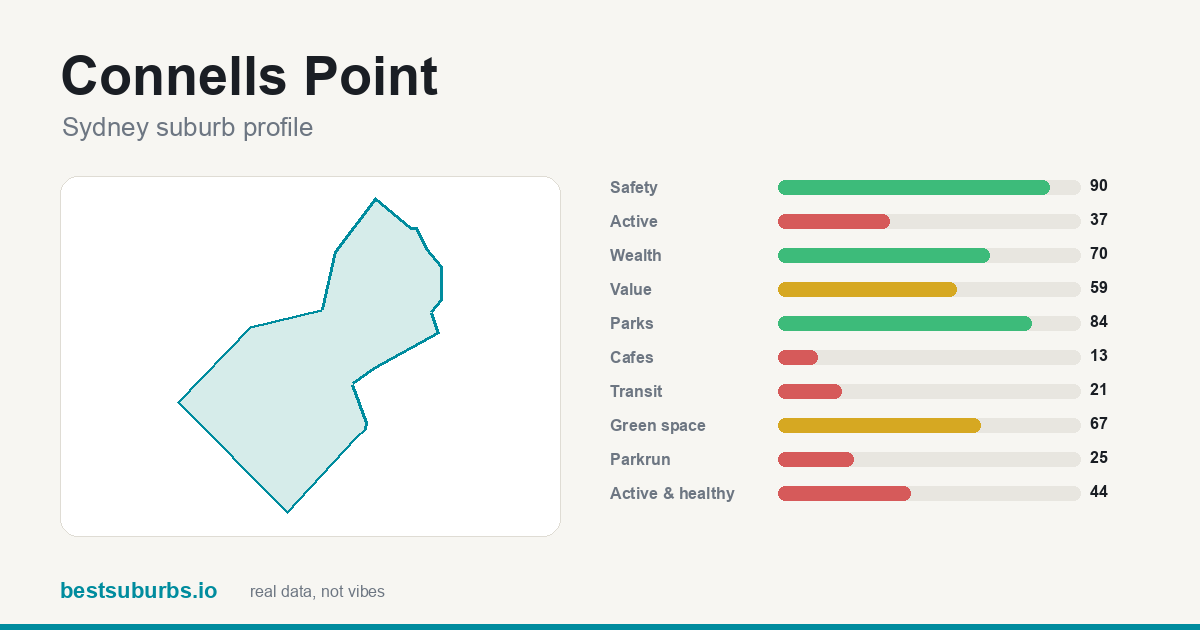 Connells Point Connells Point | 74 | 90 | 1 | 67 | 21 | $2,300,000 |
| 18 | 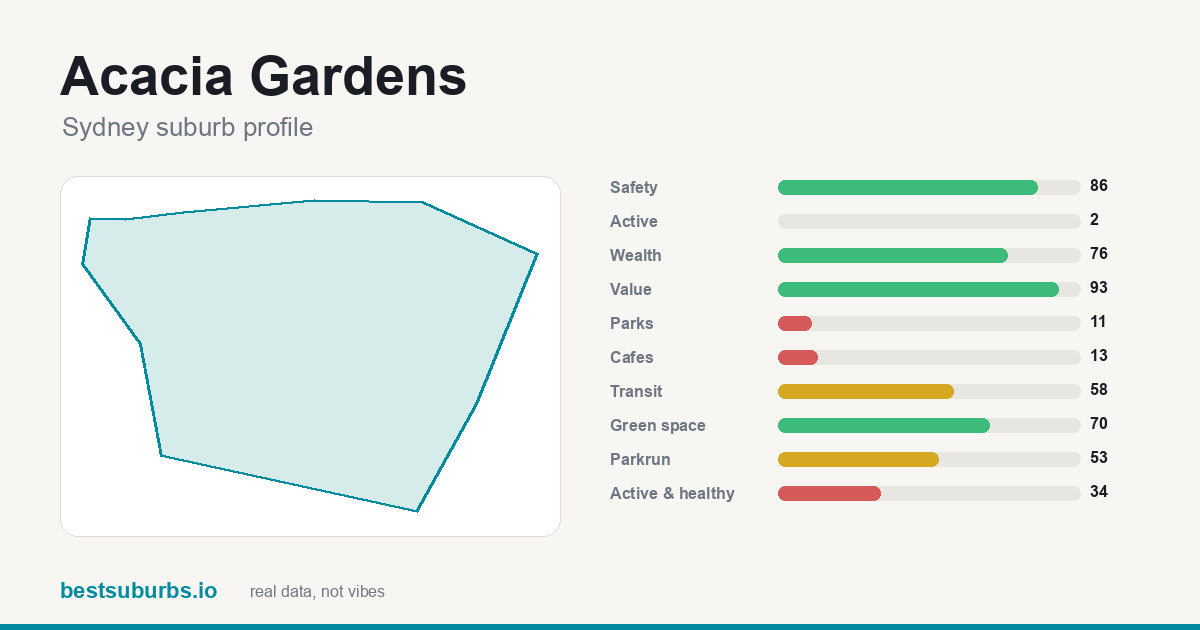 Acacia Gardens Acacia Gardens | 73 | 86 | 1 | 70 | 58 | $1,350,000 |
| 19 | 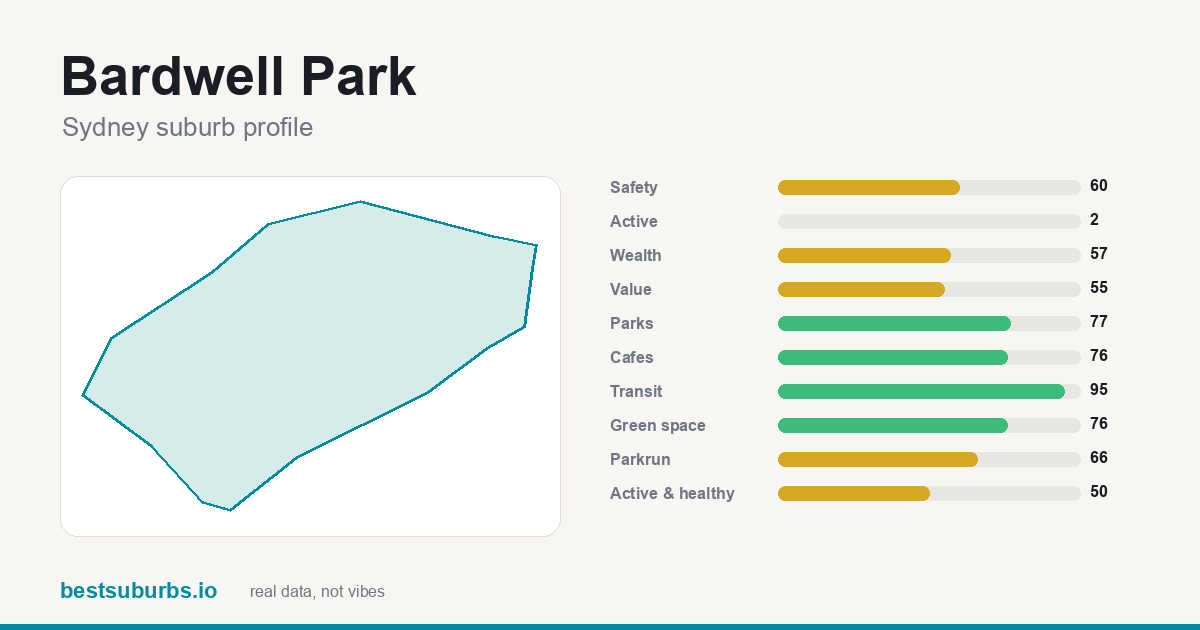 Bardwell Park Bardwell Park | 73 | 60 | 1 | 76 | 80 | $1,900,000 |
| 20 | 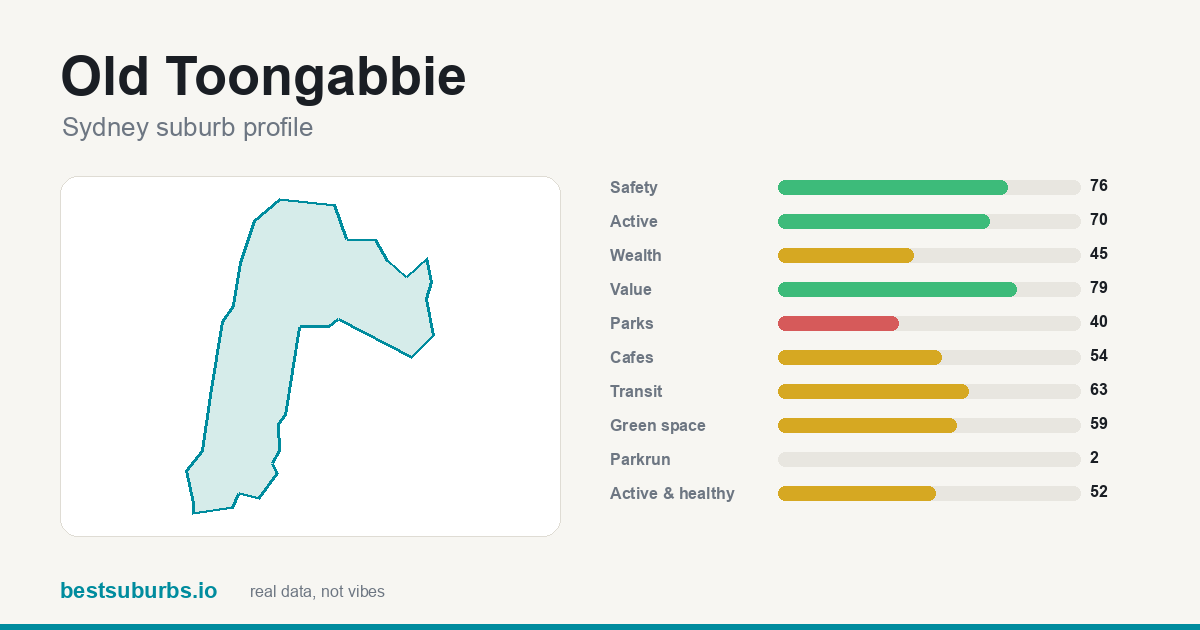 Old Toongabbie Old Toongabbie | 73 | 76 | 1 | 59 | 63 | $1,444,000 |
| 21 | 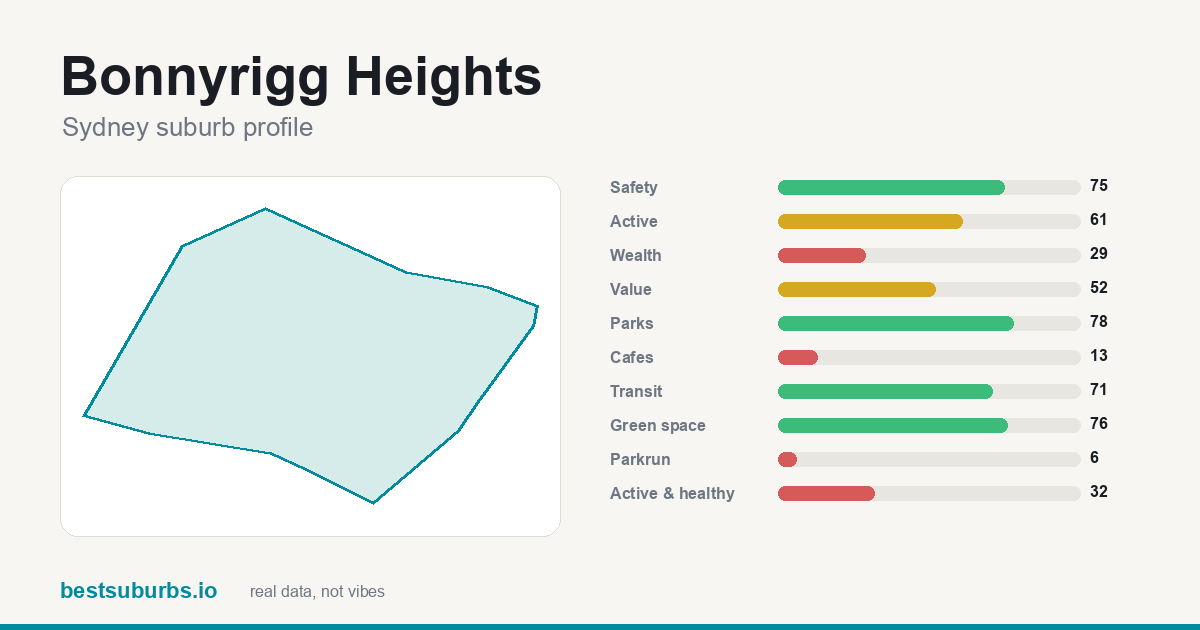 Bonnyrigg Heights Bonnyrigg Heights | 73 | 75 | 1 | 76 | 71 | $1,320,000 |
| 22 | 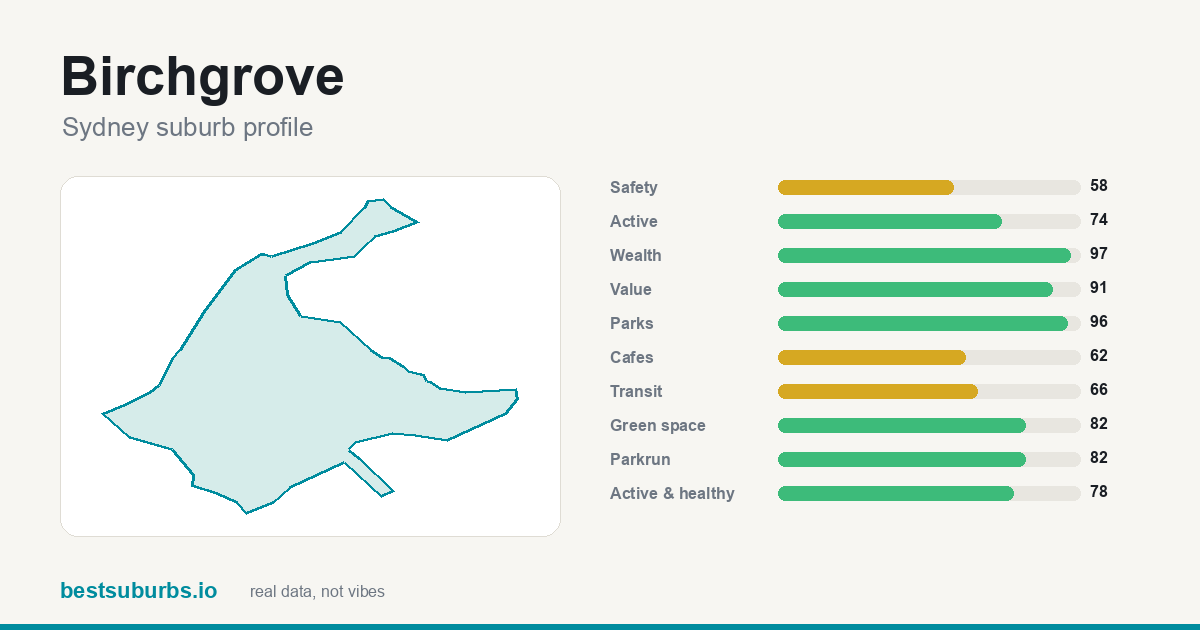 Birchgrove Birchgrove | 73 | 58 | 1 | 82 | 66 | $2,793,000 |
| 23 | 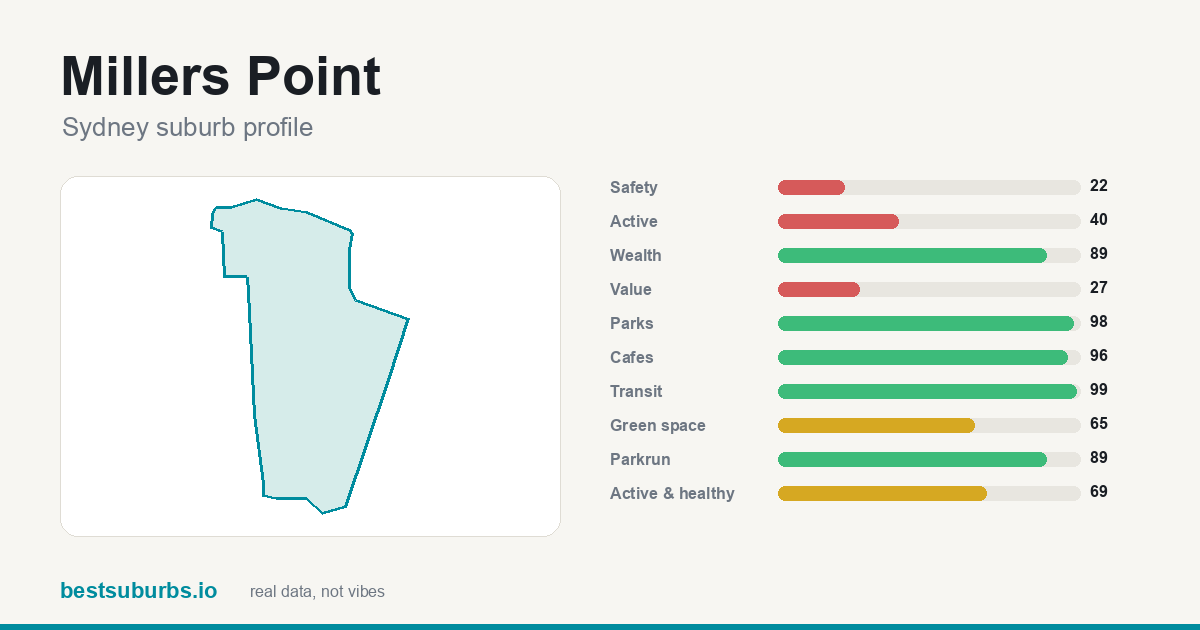 Millers Point Millers Point | 73 | 22 | 1 | 65 | 99 | — |
| 24 | 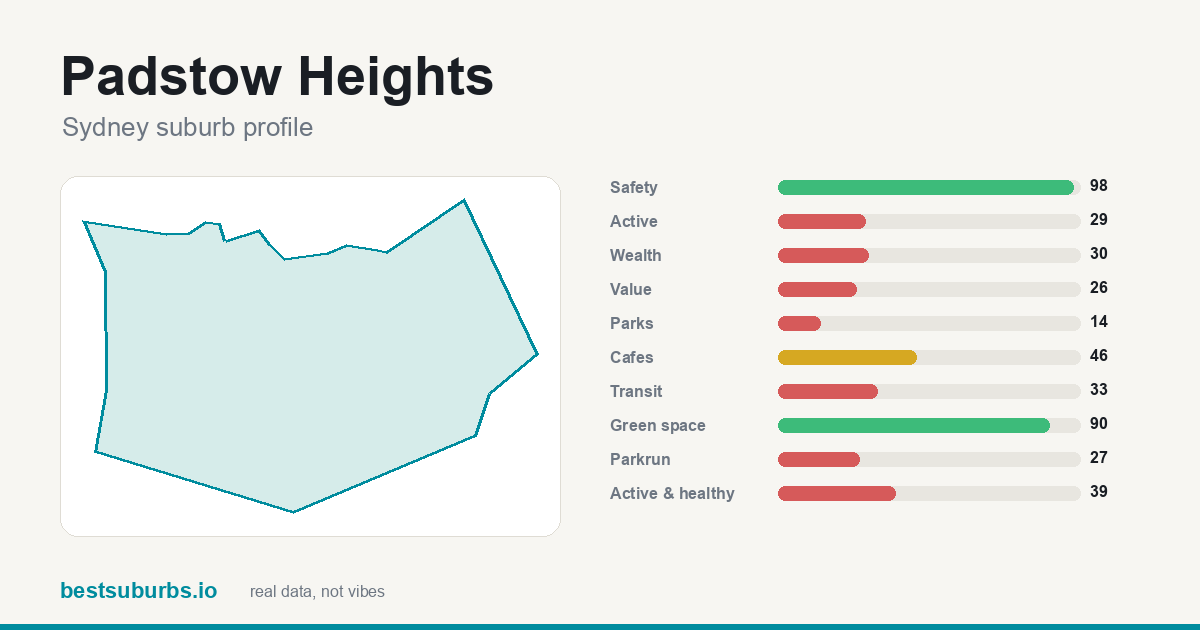 Padstow Heights Padstow Heights | 72 | 98 | 1 | 90 | 13 | $1,850,000 |
| 25 | 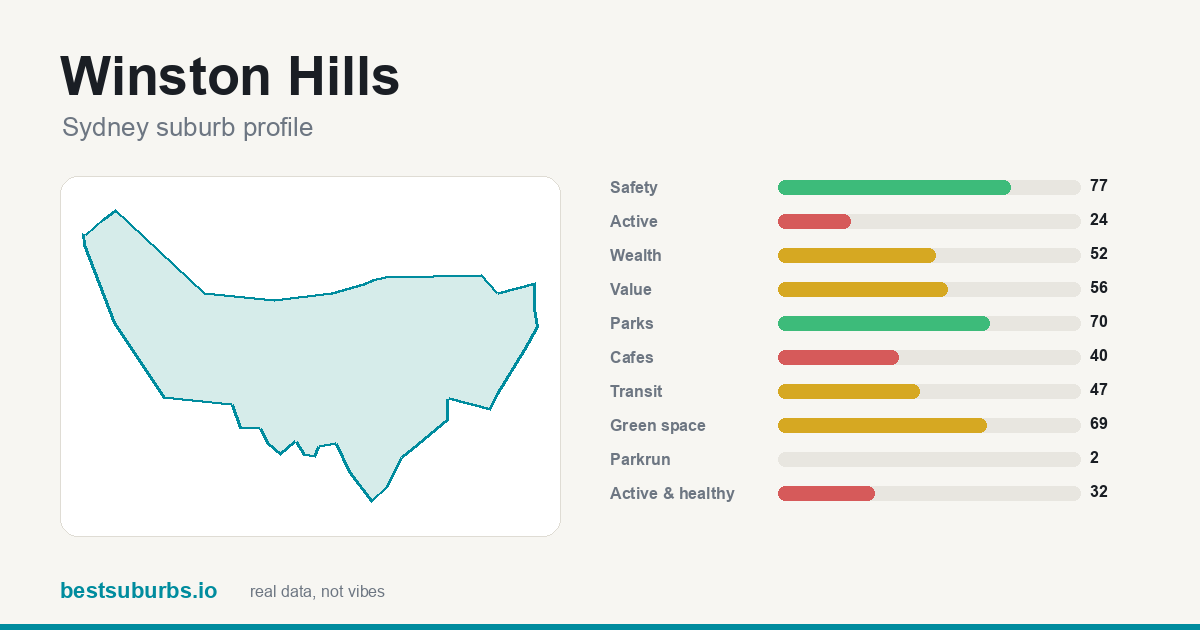 Winston Hills Winston Hills | 72 | 77 | 2 | 69 | 47 | $1,950,000 |
Showing the top 25 of 422 ranked suburbs. Scores are percentiles against every other suburb in Sydney: 100 is the best in the city, 50 is mid-table. Click any suburb for its full profile.
Why are these the 10 best Sydney suburbs for families? (October 2026)
Updated 14 October 2026 · one sentence of real reasons per suburb, from the data on this page.
- Cammeray ★ 82
Cammeray ranks #1: a recorded crime rate of about 17 offences per 1,000 residents (safety score 85/100), 100% of it within 400 m of a park, and 2 government primary schools inside the suburb.
- Bonnet Bay ★ 81
#2 Bonnet Bay — a recorded crime rate of about 15 offences per 1,000 residents (safety score 90/100), plus 93% of it within 400 m of a park, and 1 government primary school inside the suburb.
- Peakhurst Heights ★ 81
Peakhurst Heights takes #3 on 100% of it within 400 m of a park, with a recorded crime rate of about 22 offences per 1,000 residents (safety score 75/100), and 1 government primary school inside the suburb.
- Yarrawarrah ★ 79
Yarrawarrah takes #4 on a recorded crime rate of about 8 offences per 1,000 residents (safety score 99/100), with 40 public transport stops inside it for a transit score of 82, and 75% of it within 400 m of a park.
- Denistone East ★ 79
Denistone East (#5) scores on a recorded crime rate of about 14 offences per 1,000 residents (safety score 91/100) and 100% of it within 400 m of a park, and 26 public transport stops inside it for a transit score of 88.
- East Lindfield ★ 78
#6 East Lindfield — a recorded crime rate of about 9 offences per 1,000 residents (safety score 98/100), plus 99% of it within 400 m of a park, and 9.9 ha of parkland per 1,000 residents.
- Grays Point ★ 77
#7 Grays Point — a recorded crime rate of about 12 offences per 1,000 residents (safety score 95/100), plus 73% of it within 400 m of a park, and 1 government primary school inside the suburb.
- The Ponds ★ 77
What lifts The Ponds to #8 is a recorded crime rate of about 16 offences per 1,000 residents (safety score 87/100); it also has 97% of it within 400 m of a park, and 2 government primary schools and 1 secondary inside the suburb.
- Alfords Point ★ 76
Alfords Point ranks #9: 100% of it within 400 m of a park, a recorded crime rate of about 24 offences per 1,000 residents (safety score 71/100), and 30.3 ha of parkland per 1,000 residents.
- Ashbury ★ 76
Ashbury ranks #10: 100% of it within 400 m of a park, a recorded crime rate of about 25 offences per 1,000 residents (safety score 68/100), and 1 government primary school and 1 secondary inside the suburb.
Why each of the top 10 suburbs for families in Sydney ranks where it does
Written from this page's own data: each figure below is the suburb's own value, set against the Sydney median where we hold one.
1. Cammeray
Cammeray is #1 of 422 ranked Sydney suburbs on this list, with a score of 82/100. Its strongest family components are kinders and childcare 93, schools 88, safety 85 (each out of 100). The trade-off: it scores 40/100 for public transport, so it is weaker there. It covers 1.6 km² with about 7,088 residents (census).
2. Bonnet Bay
Bonnet Bay is #2 of 422 ranked Sydney suburbs on this list, with a score of 81/100. Its strongest family components are schools 96, safety 90, house price for the size 88 (each out of 100). It covers 1.5 km² with about 2,238 residents (census).
3. Peakhurst Heights
Peakhurst Heights is #3 of 422 ranked Sydney suburbs on this list, with a score of 81/100. Its strongest family components are house price for the size 98, schools 96, green space 94 (each out of 100). The trade-off: it scores 16/100 for activity, so it is weaker there. It covers 1 km² with about 2,524 residents (census).
4. Yarrawarrah
Yarrawarrah is #4 of 422 ranked Sydney suburbs on this list, with a score of 79/100. Its strongest family components are house price for the size 100, safety 99, schools 94 (each out of 100). The trade-off: it scores 13/100 for cafés, so it is weaker there. It covers 1.2 km² with about 2,775 residents (census).
5. Denistone East
Denistone East is #5 of 422 ranked Sydney suburbs on this list, with a score of 79/100. Its strongest family components are schools 96, green space 92, safety 91 (each out of 100). The trade-off: it scores 13/100 for cafés, so it is weaker there. It covers 0.7 km² with about 2,292 residents (census).
6. East Lindfield
East Lindfield is #6 of 422 ranked Sydney suburbs on this list, with a score of 78/100. Its strongest family components are safety 98, kinders and childcare 93, schools 87 (each out of 100). The trade-off: it scores 9/100 for value for rent, so it is weaker there. It covers 2.3 km² with about 3,710 residents (census).
7. Grays Point
Grays Point is #7 of 422 ranked Sydney suburbs on this list, with a score of 77/100. Its strongest family components are kinders and childcare 99, safety 95, house price for the size 94 (each out of 100). The trade-off: it scores 10/100 for parks, so it is weaker there. It covers 1.9 km² with about 3,034 residents (census).
8. The Ponds
The Ponds is #8 of 422 ranked Sydney suburbs on this list, with a score of 77/100. Its strongest family components are house price for the size 100, safety 87, schools 85 (each out of 100). The trade-off: it scores 13/100 for activity, so it is weaker there. It covers 4.9 km² with about 16,315 residents (census).
9. Alfords Point
Alfords Point is #9 of 422 ranked Sydney suburbs on this list, with a score of 76/100. Its strongest family components are kinders and childcare 95, schools 92, green space 88 (each out of 100). The trade-off: it scores 6/100 for public transport, so it is weaker there. It covers 3 km² with about 3,131 residents (census).
10. Ashbury
Ashbury is #10 of 422 ranked Sydney suburbs on this list, with a score of 76/100. Its strongest family components are schools 99, kinders and childcare 99, safety 68 (each out of 100). It covers 1.1 km² with about 3,353 residents (census).
How do these suburbs compare head to head?
What else do people ask about suburbs for families in Sydney?
What are the best suburbs in Sydney for families?
On our October 2026 data the top five are Cammeray (82/100), Bonnet Bay (81/100), Peakhurst Heights (81/100), Yarrawarrah (79/100), Denistone East (79/100), out of 422 ranked Sydney suburbs.
How is this ranking calculated?
Families score v2 (10 September 2026): safety 30%, schools 25% (schools per 1,000 residents from government school-location data where available, plus a primary within 800 m and a secondary within 2 km), parks and green space per 1,000 residents 15%, kinders and childcare per 1,000 10%, house price for the size 10% (median house price against the city median, gently), and public transport 10%. Weights are renormalised where a city lacks a component. v1 penalised dense inner suburbs for park hectares and leaned on OpenStreetMap school points; see the honesty note below. 422 of 422 Sydney suburbs had enough data to be ranked. Updated October 2026.
Is this ranking sponsored?
No. No ranking on this site is sold or sponsored. It is computed from open data: GPS activity traces, official crime statistics, the ABS census and OpenStreetMap.
What other Sydney rankings are there?
Sources: open GPS activity traces, official crime statistics, ABS census,
OpenStreetMap (ODbL). Sale prices: NSW DCJ Rent and Sales Report, January - March 2026 quarter — © State of New South Wales (Department of Communities and Justice), Rent and Sales Report, CC BY 4.0; suburb-to-postcode mapping © GeoNames.org, CC BY 4.0. NSW publishes no free suburb-level sale medians, so this is the median for the suburb's POSTCODE (non-strata sales = houses, strata = units), which can span several suburbs. Low-volume figures rest on 30 or fewer sales in the quarter; postcodes with 10 or fewer sales are withheld by DCJ. No ranking on this site is sold or sponsored.
← all 422 Sydney suburbs, with sliders