Best suburbs in Brisbane for coffee
Café density per resident, not raw café counts — so a big suburb cannot buy its way up.
Brisbane City (100/100), South Brisbane (99/100), Stones Corner (99/100) lead this ranking of 277 Brisbane suburbs.
By BestSuburbs research · Updated October 2026
Part of Brisbane suburb rankings · all Brisbane lists
Which Brisbane suburbs are best for coffee?
How do the top 25 compare, measure by measure?
| # | Suburb | Cafés per 1,000 | Café score | Median house price |
|---|---|---|---|---|
| 1 | 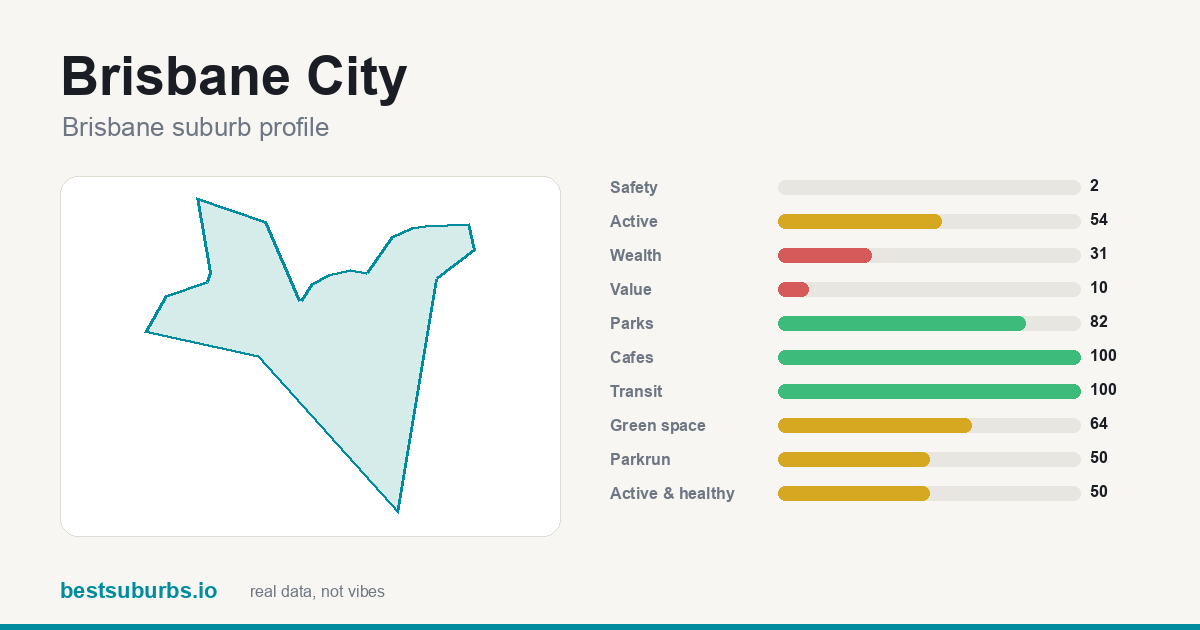 Brisbane City Brisbane City | 8.0 | 100 | $1,285,000 |
| 2 | 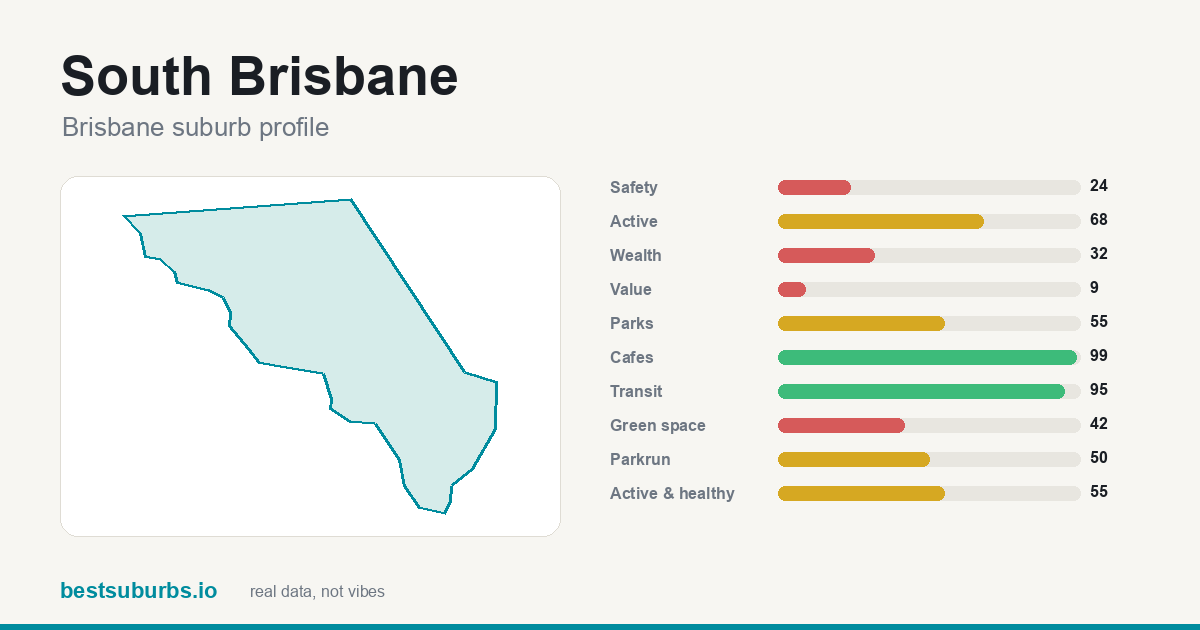 South Brisbane South Brisbane | 3.8 | 99 | — |
| 3 | 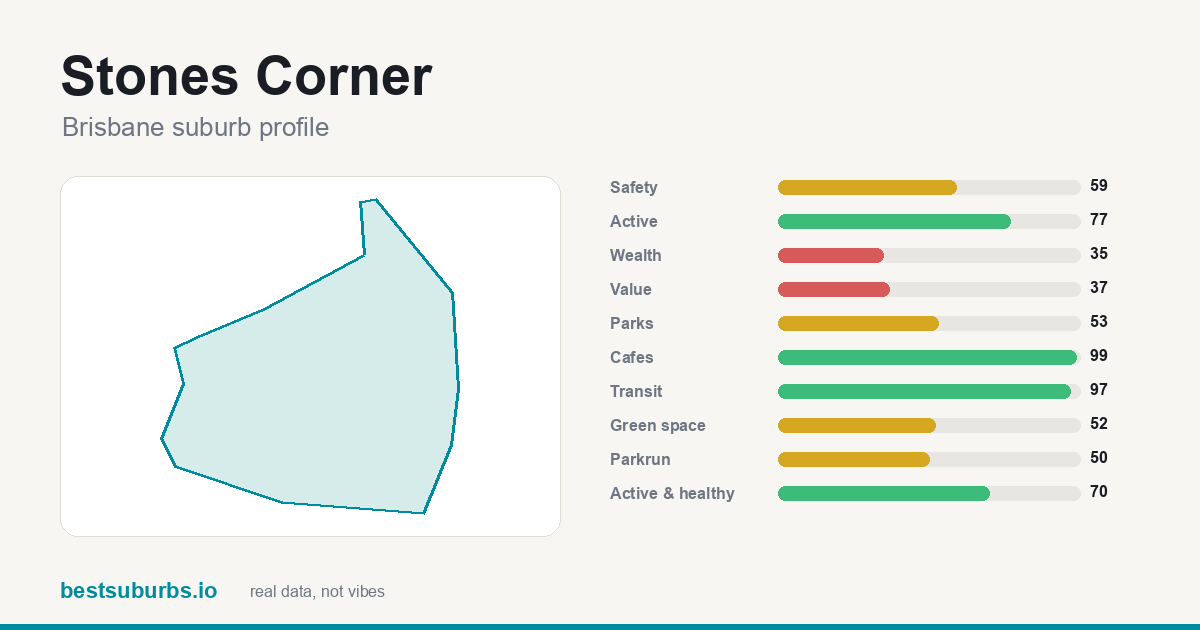 Stones Corner Stones Corner | 4.7 | 99 | $1,400,000 |
| 4 | 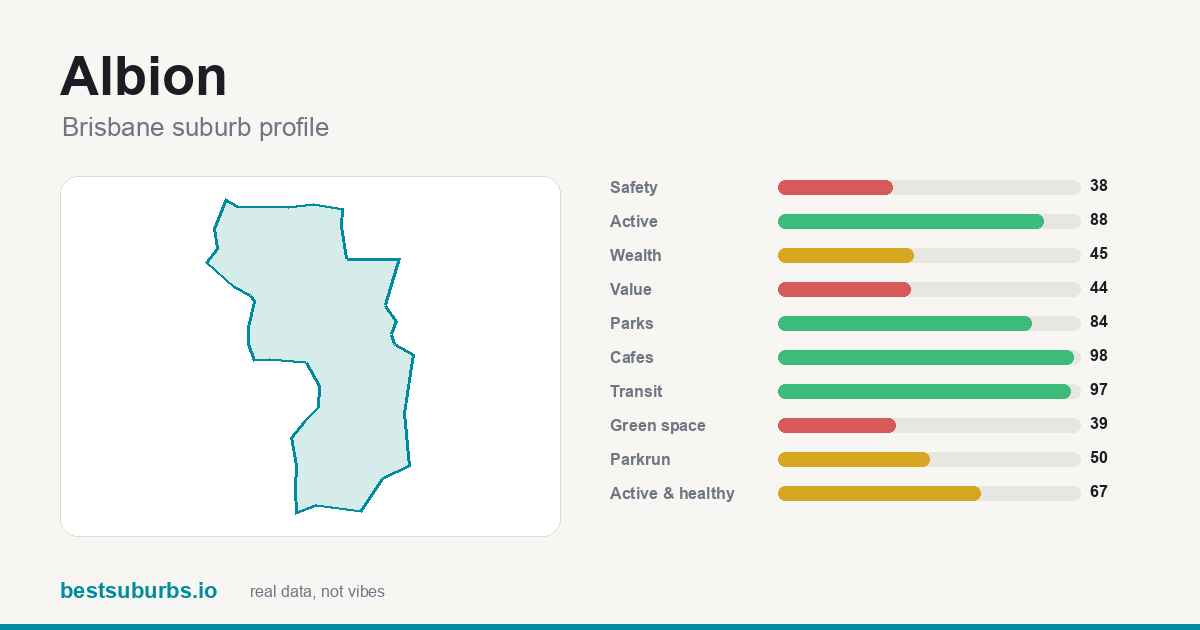 Albion Albion | 3.5 | 98 | $1,455,000 |
| 5 | 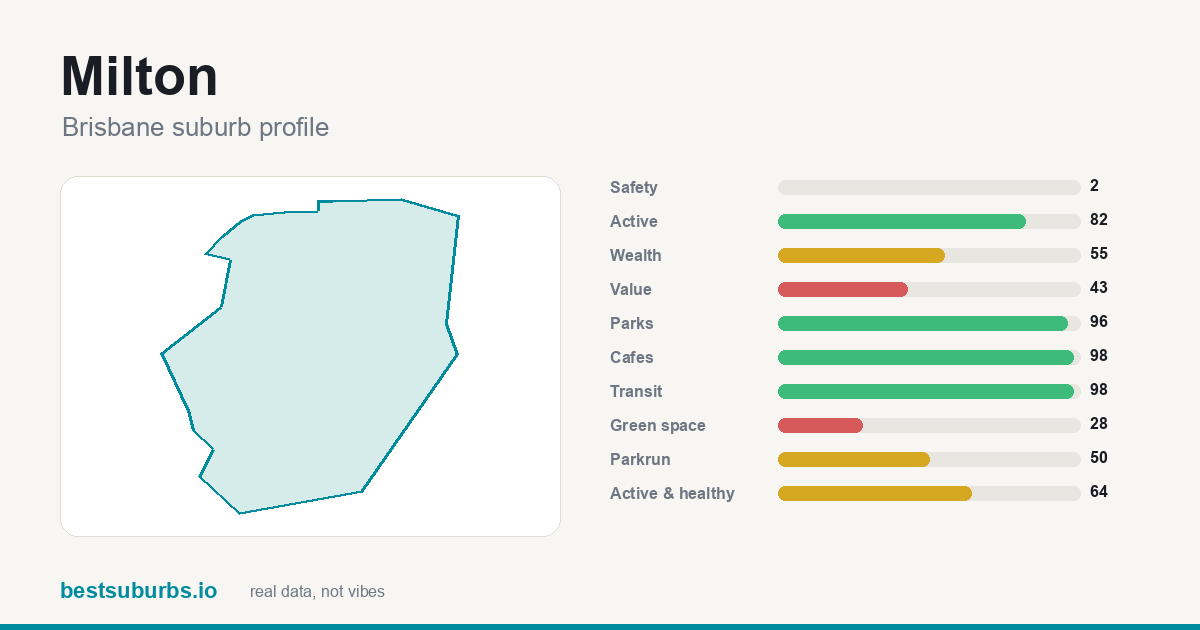 Milton Milton | 4.5 | 98 | $2,150,000 |
| 6 | 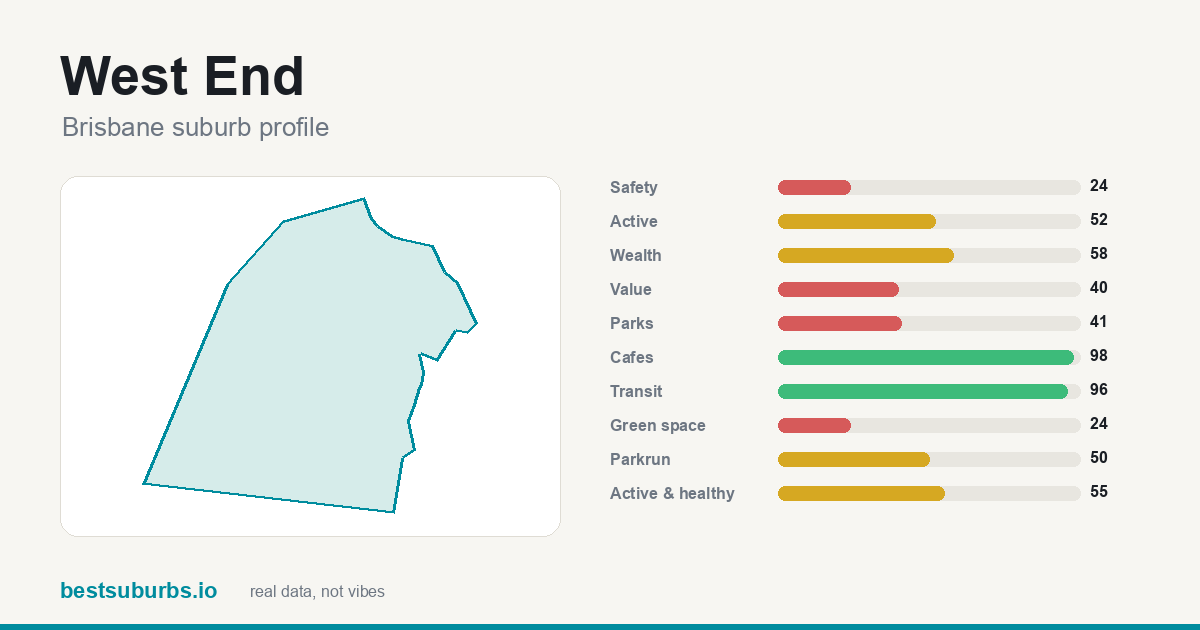 West End West End | 3.3 | 98 | $2,075,000 |
| 7 | 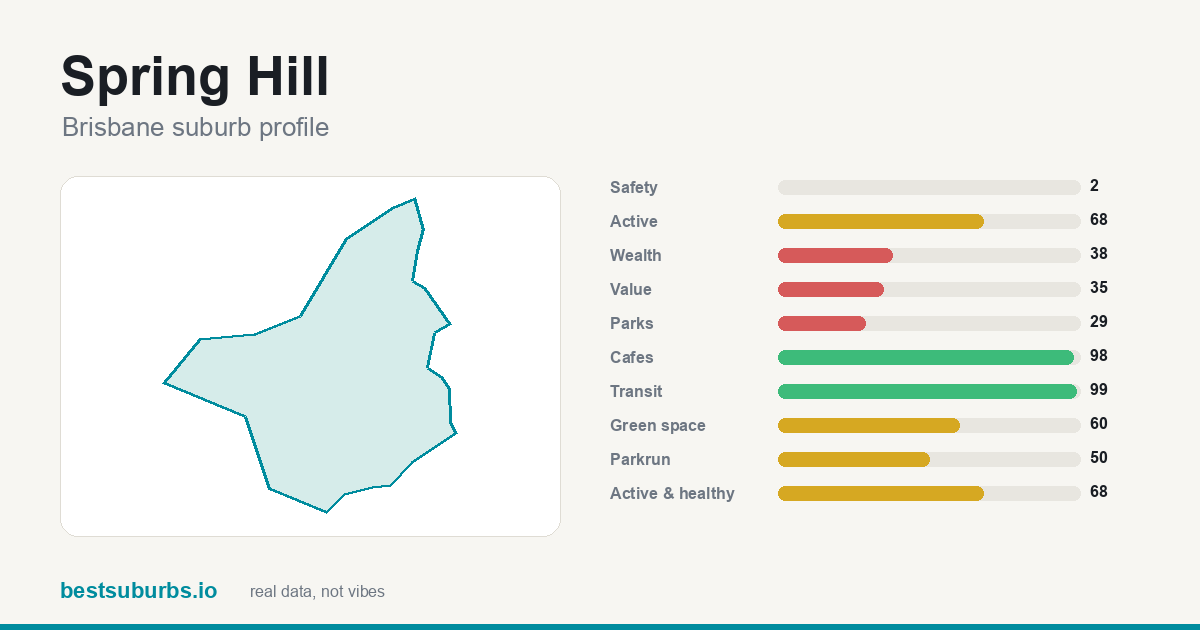 Spring Hill Spring Hill | 2.7 | 98 | $1,955,000 |
| 8 | 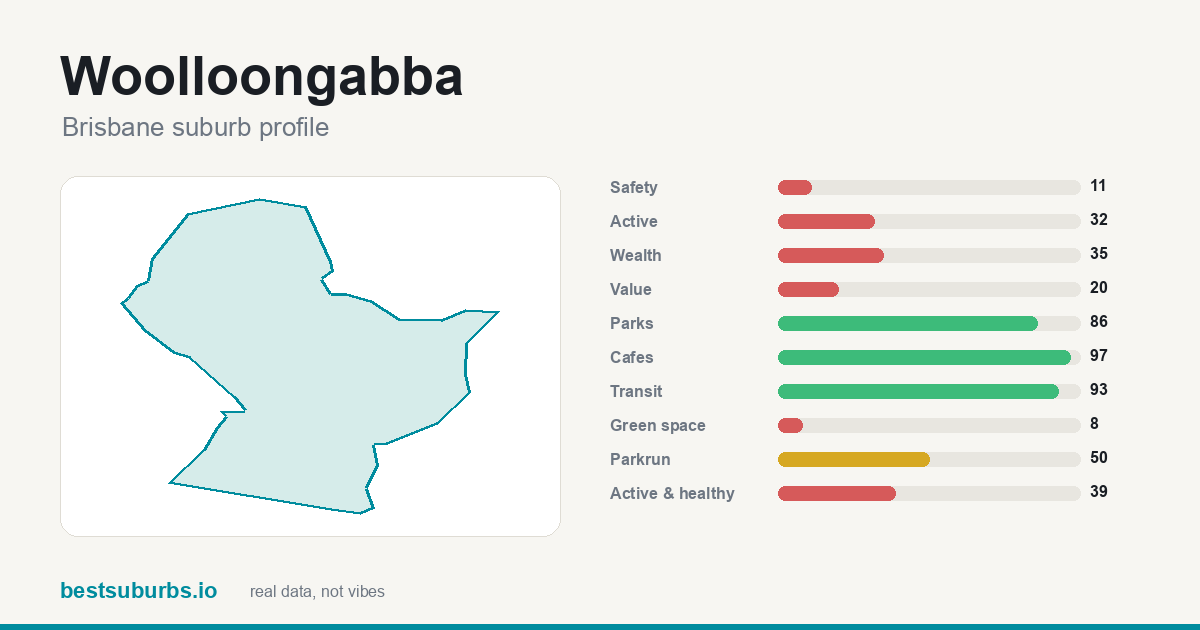 Woolloongabba Woolloongabba | 2.6 | 97 | $1,500,000 |
| 9 | 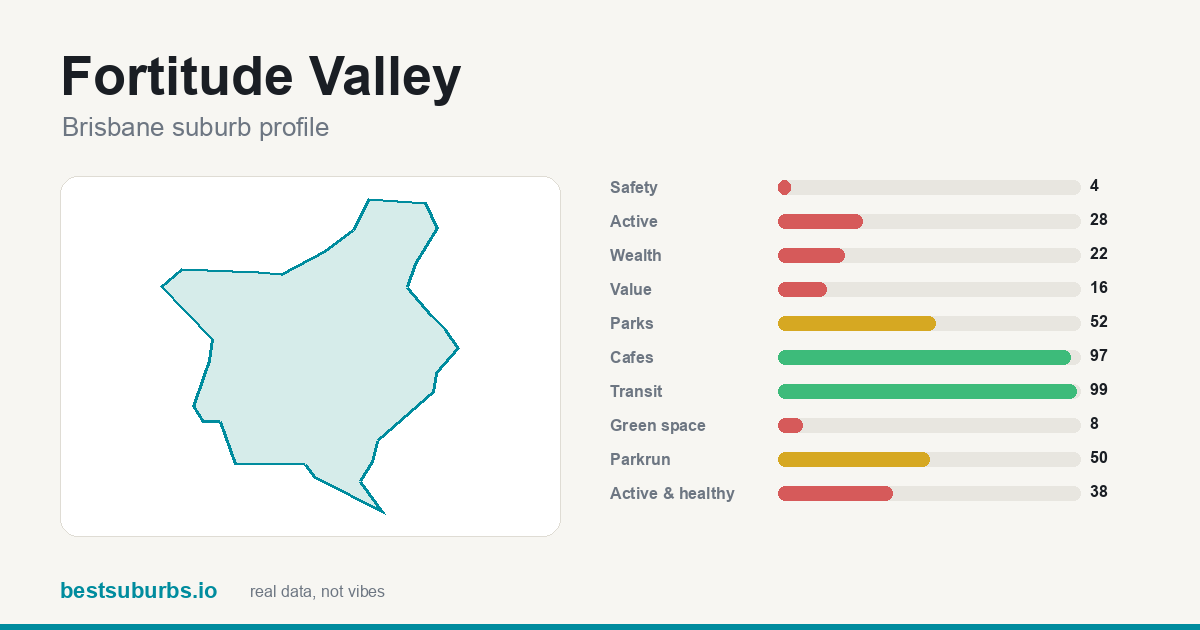 Fortitude Valley Fortitude Valley | 2.4 | 97 | — |
| 10 | 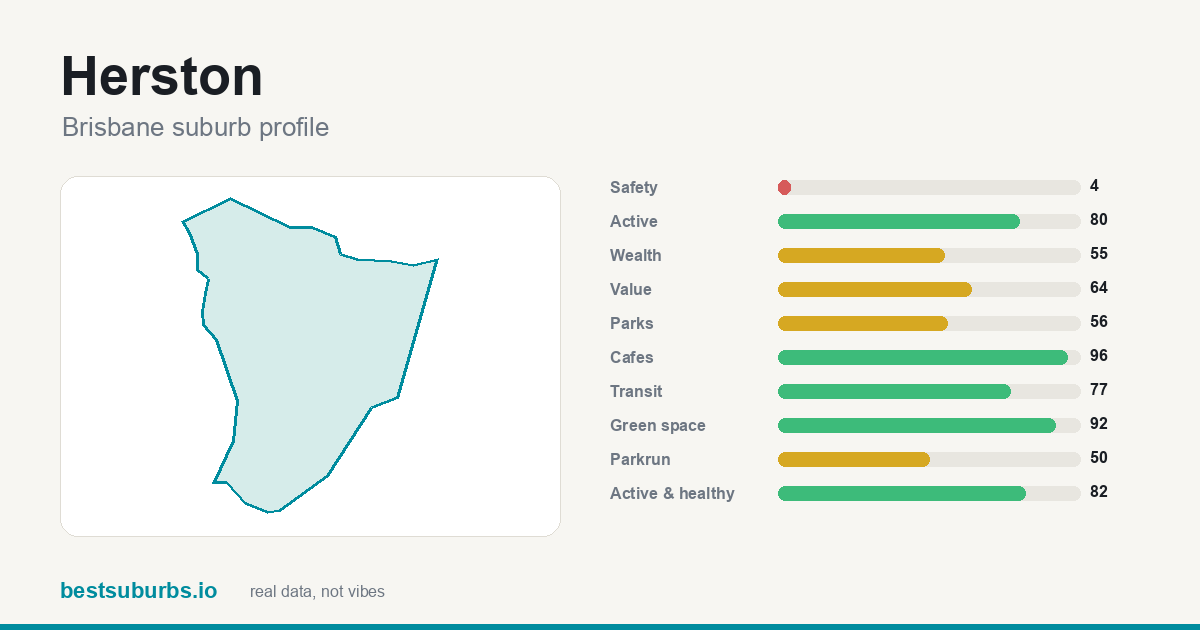 Herston Herston | 3.0 | 96 | $1,500,000 |
| 11 | 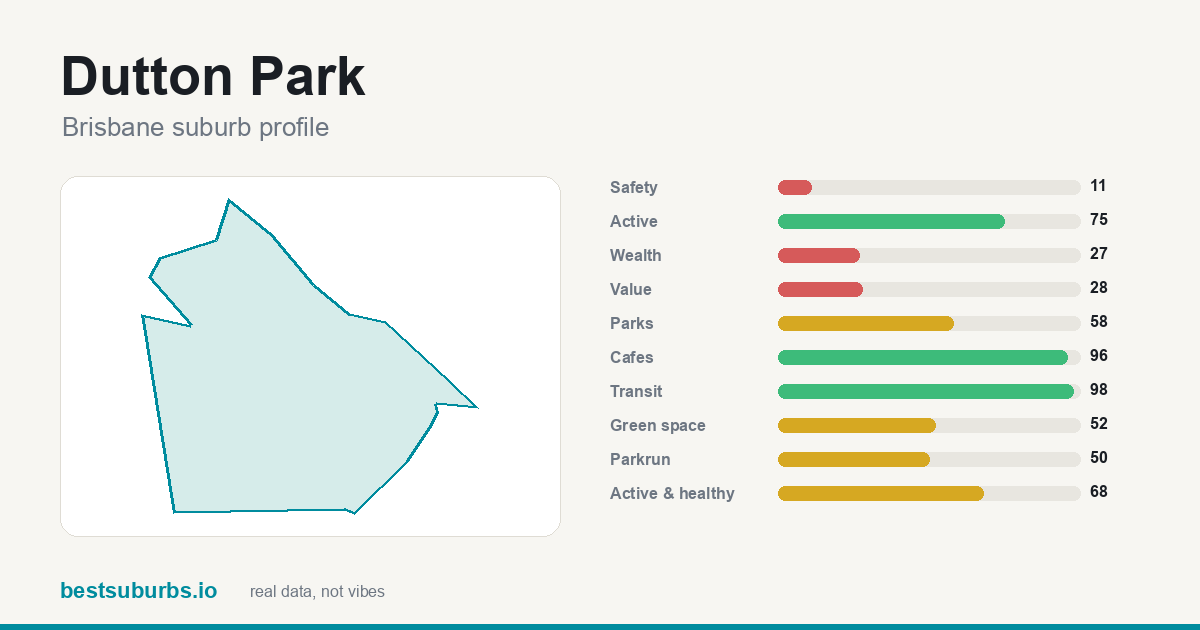 Dutton Park Dutton Park | 2.8 | 96 | $1,300,000 |
| 12 | 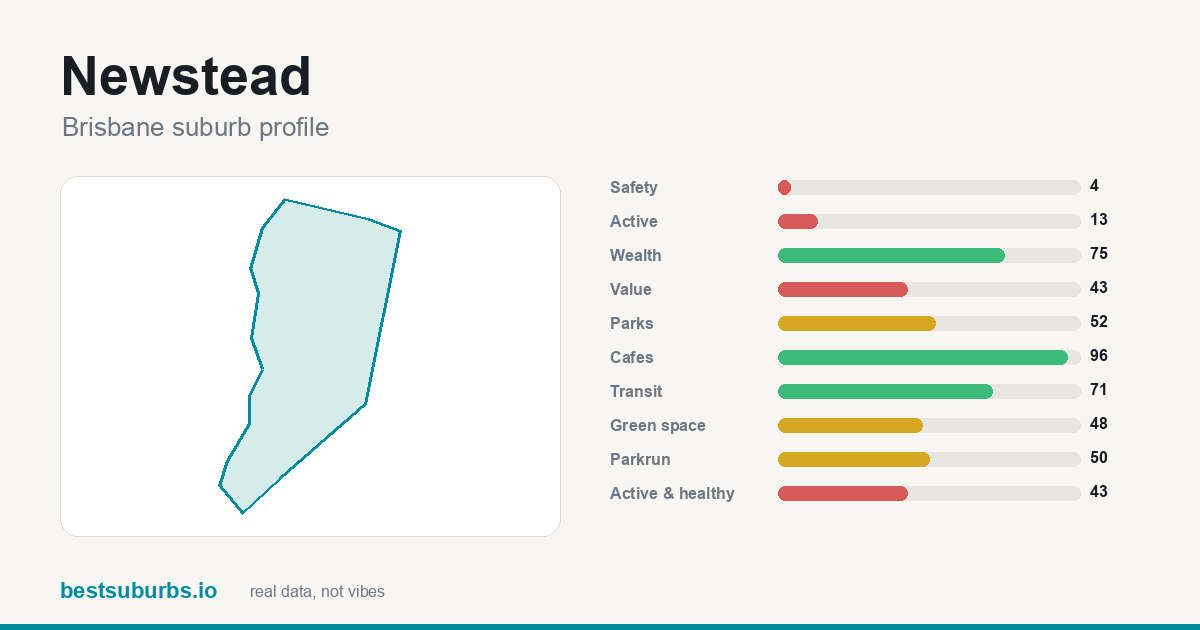 Newstead Newstead | 1.9 | 96 | $3,775,000 |
| 13 | 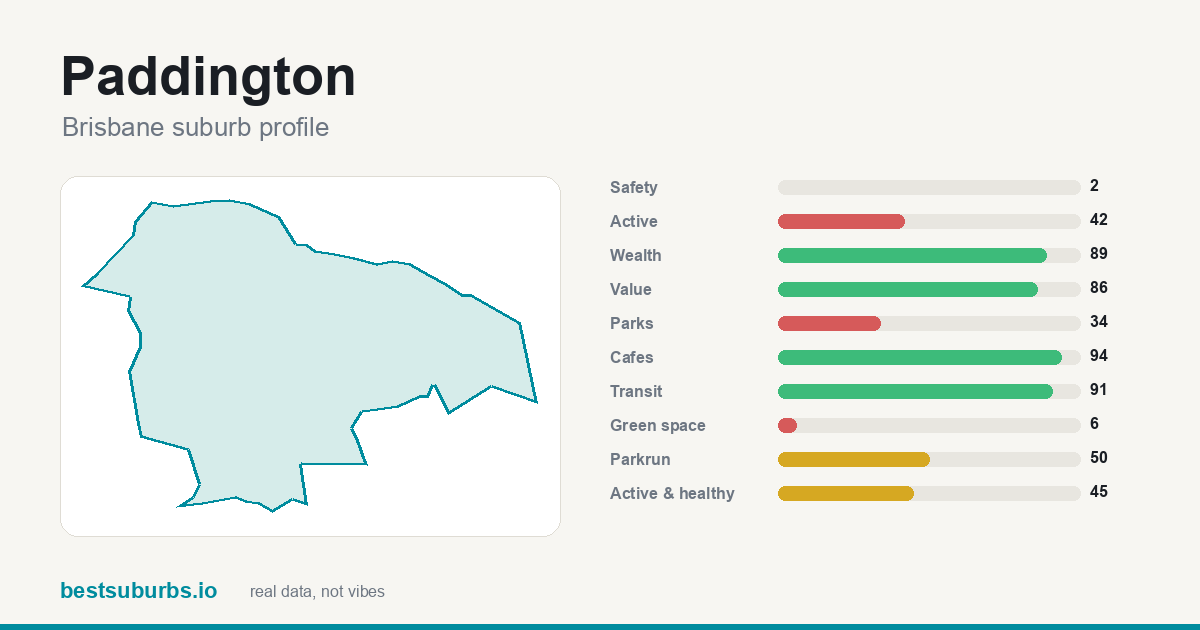 Paddington Paddington | 1.7 | 94 | $2,150,000 |
| 14 | 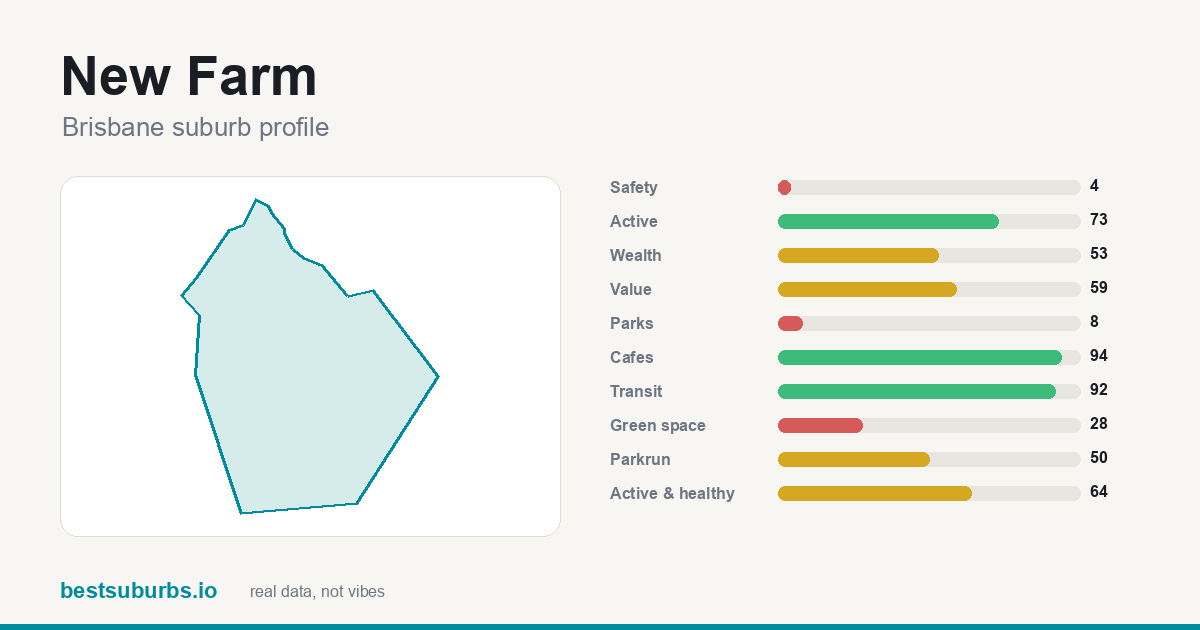 New Farm New Farm | 1.6 | 94 | $3,400,000 |
| 15 | 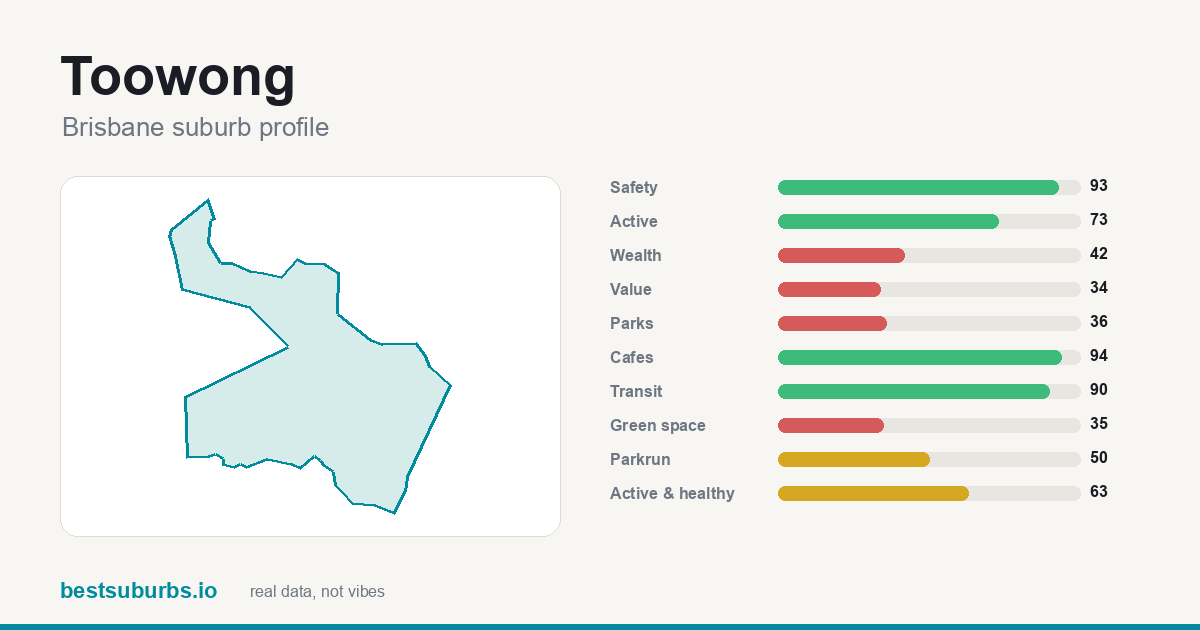 Toowong Toowong | 1.9 | 94 | $1,850,000 |
| 16 | 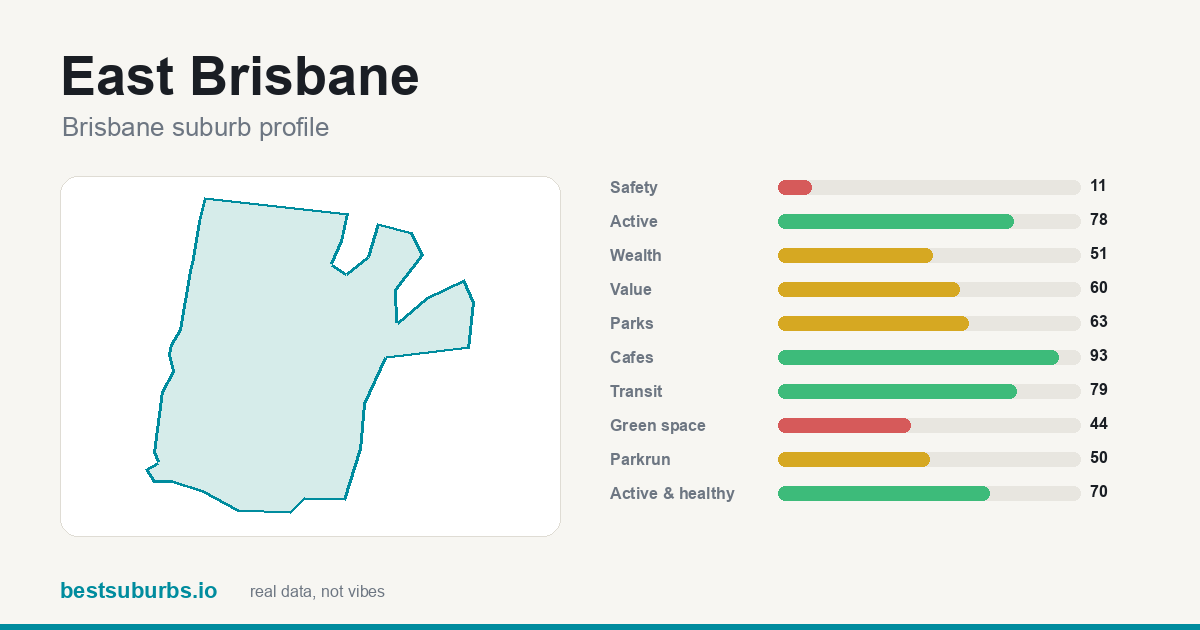 East Brisbane East Brisbane | 1.6 | 93 | $1,600,000 |
| 17 | 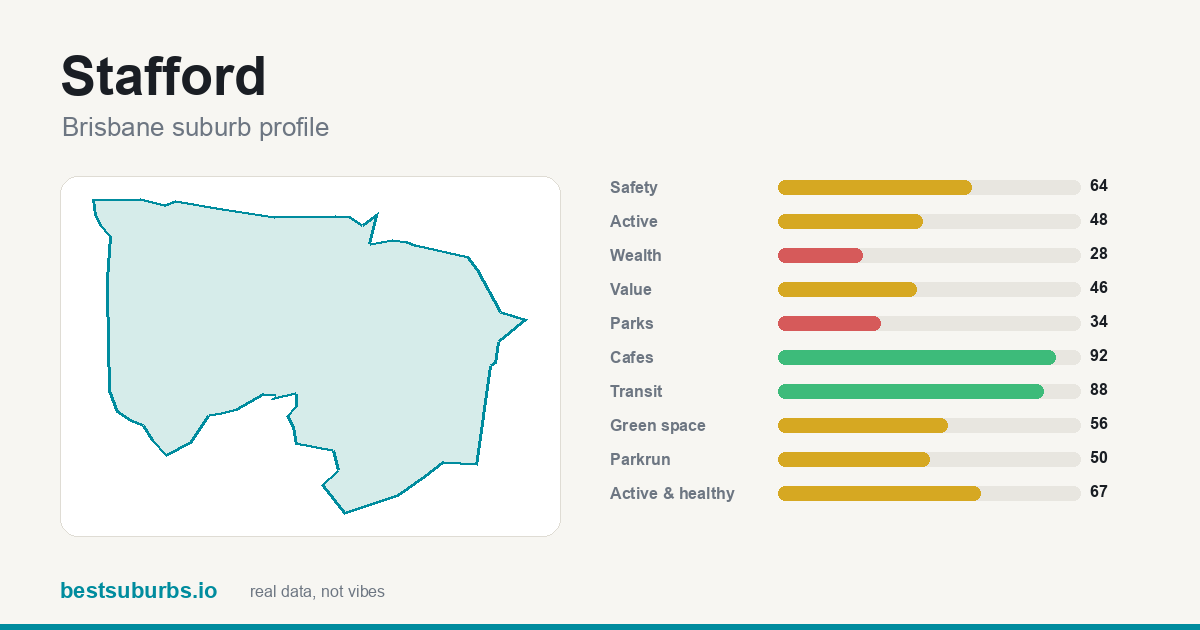 Stafford Stafford | 1.7 | 92 | $1,300,000 |
| 18 | 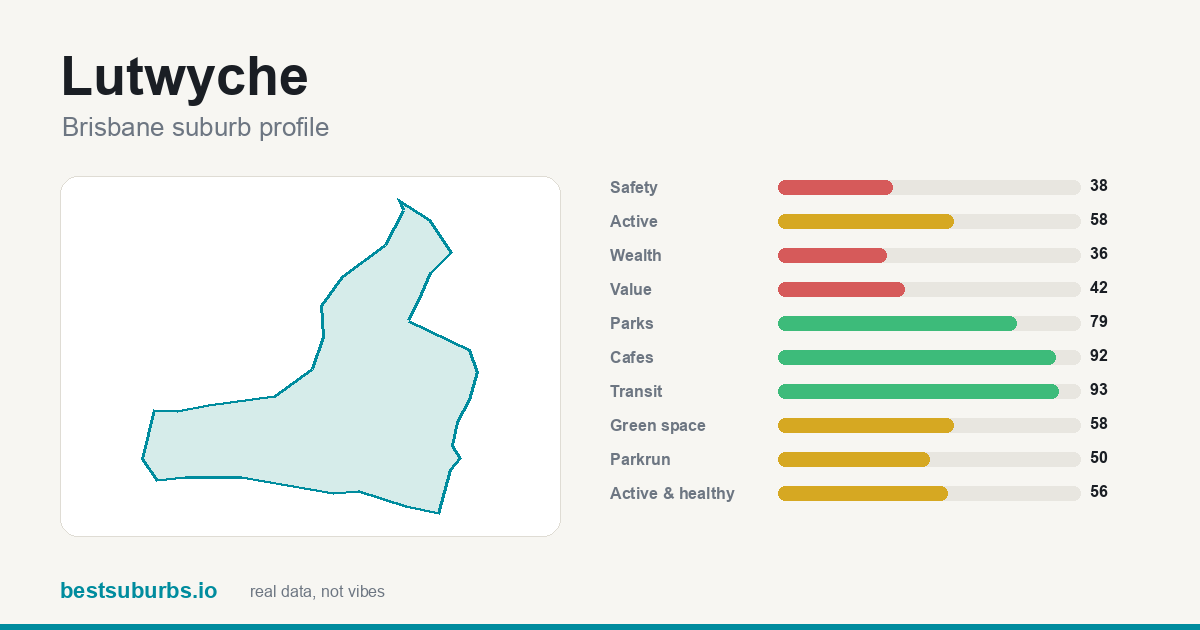 Lutwyche Lutwyche | 1.3 | 92 | $1,525,000 |
| 19 | 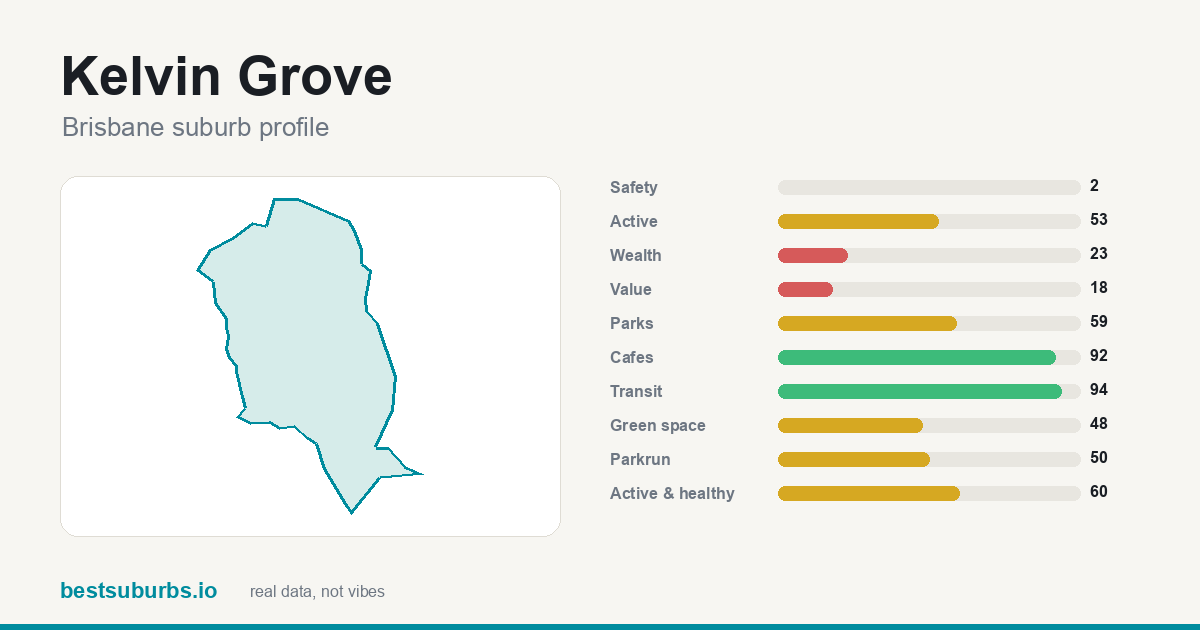 Kelvin Grove Kelvin Grove | 1.3 | 92 | $1,500,000 |
| 20 | 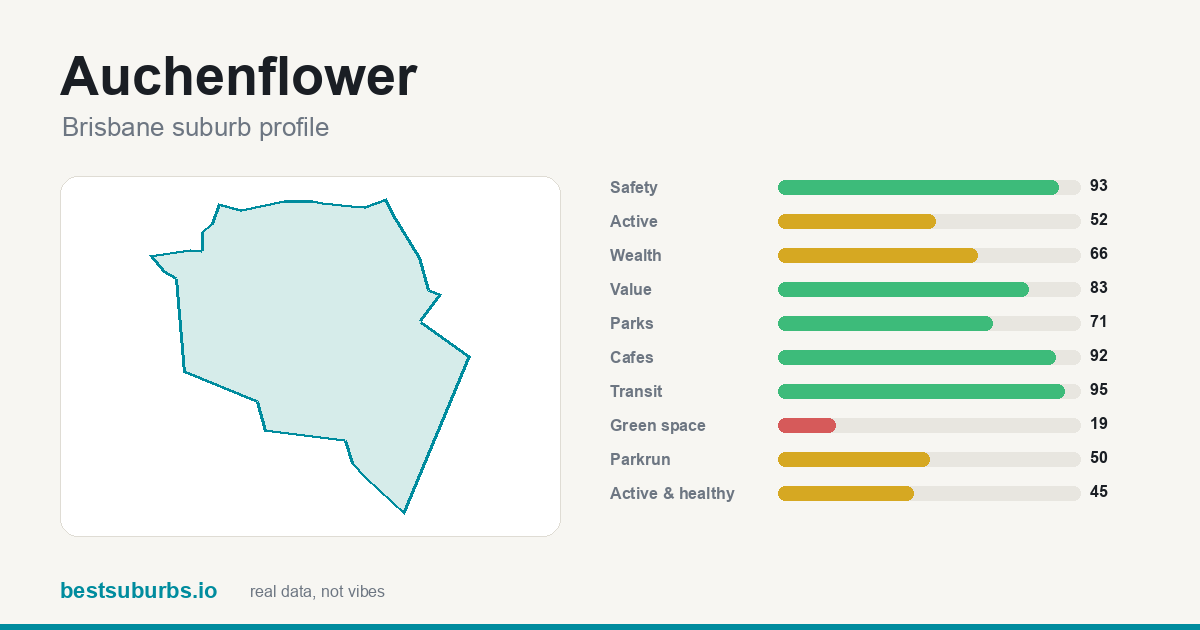 Auchenflower Auchenflower | 1.3 | 92 | $1,925,000 |
| 21 | 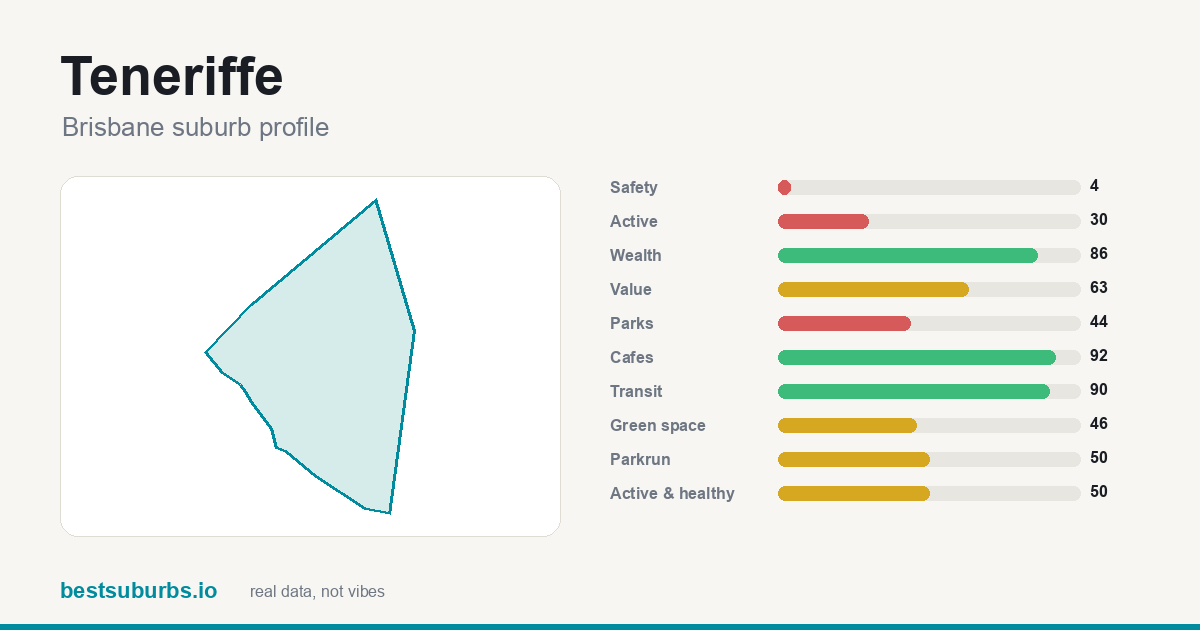 Teneriffe Teneriffe | 1.3 | 92 | $3,775,000 |
| 22 | 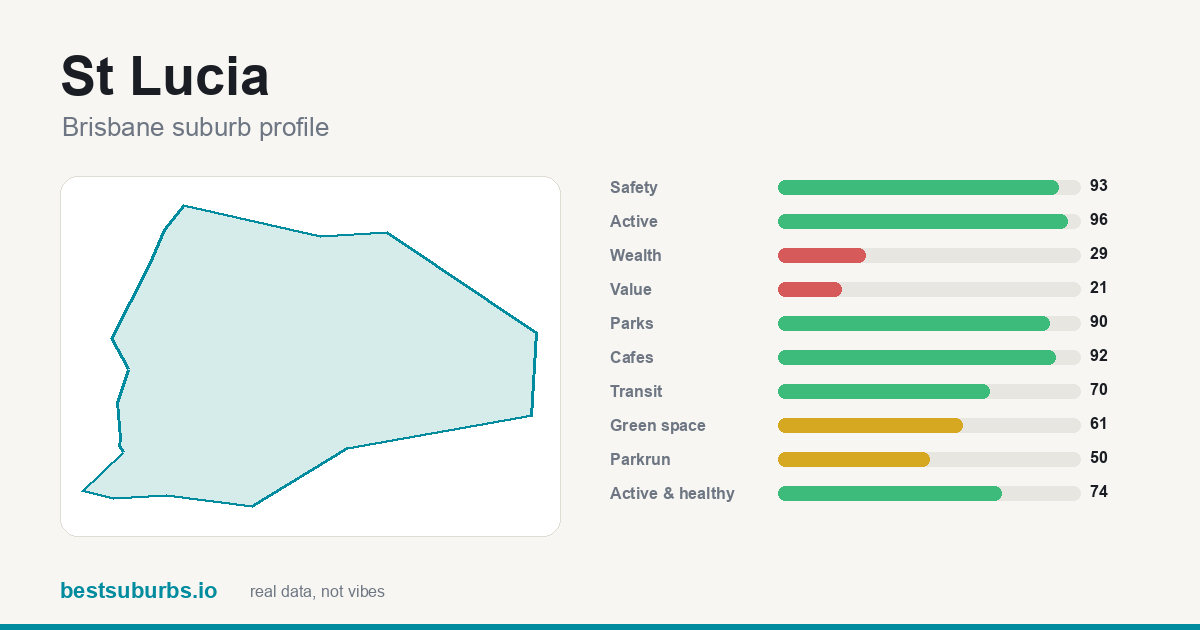 St Lucia St Lucia | 1.5 | 92 | $2,070,000 |
| 23 | 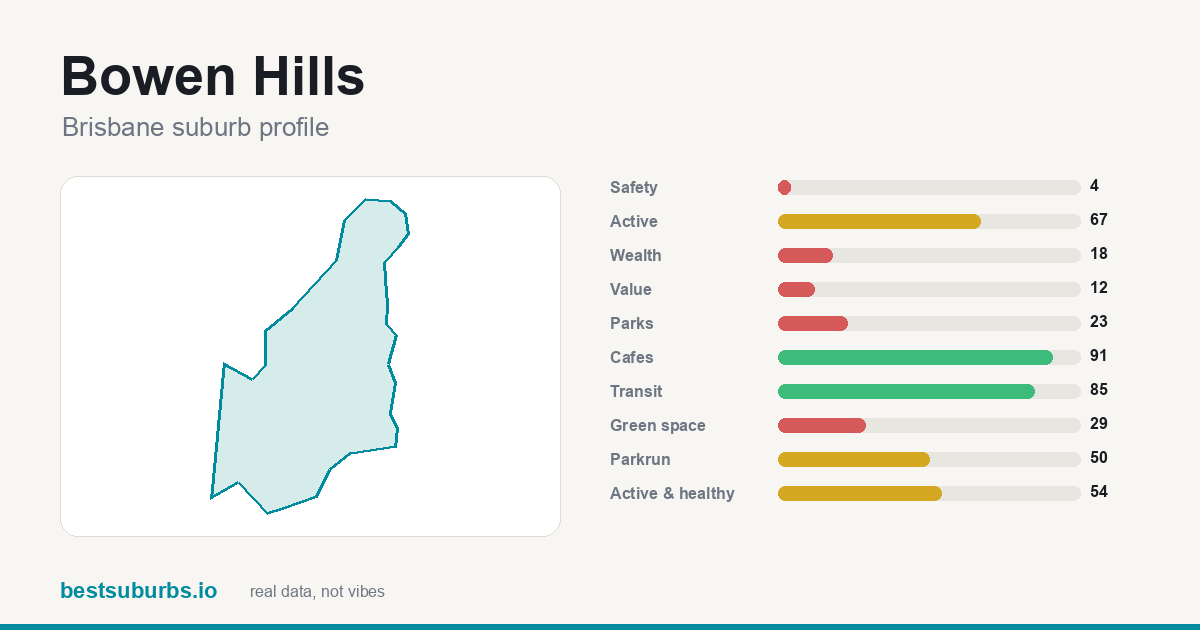 Bowen Hills Bowen Hills | 1.4 | 91 | $3,775,000 |
| 24 | 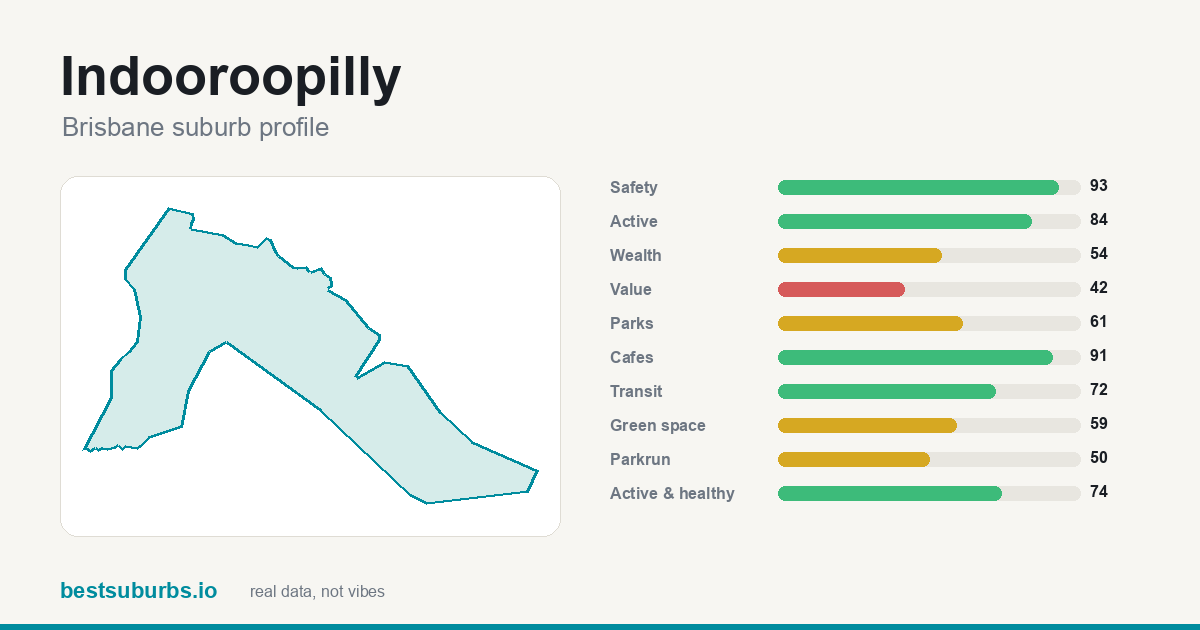 Indooroopilly Indooroopilly | 1.7 | 91 | $1,820,000 |
| 25 | 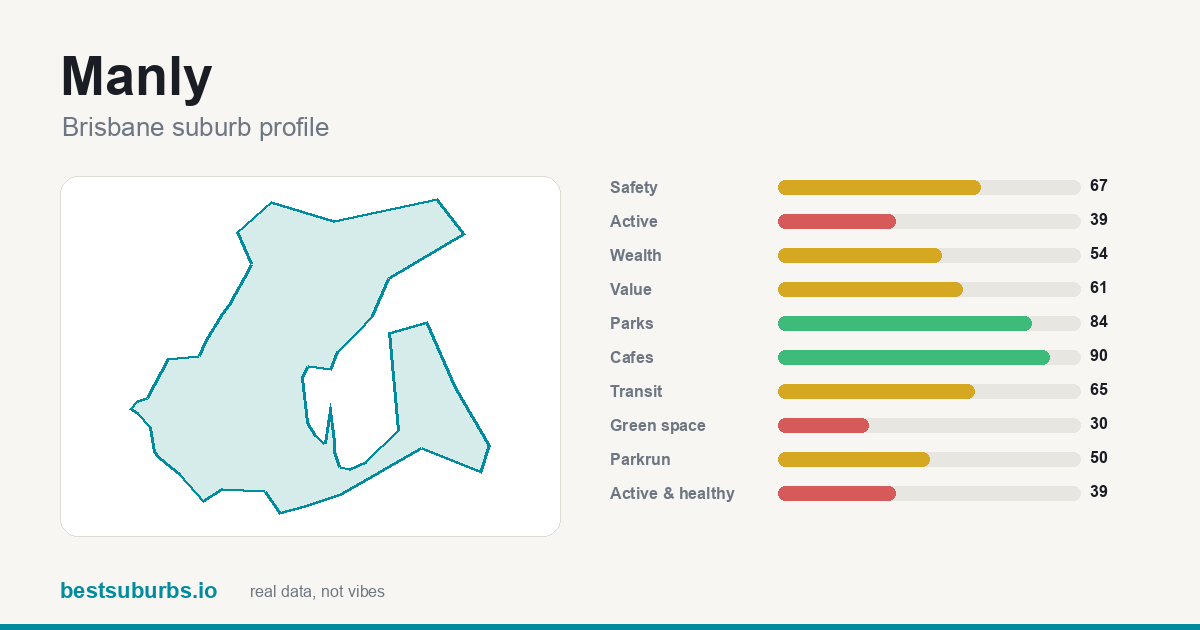 Manly Manly | 1.6 | 90 | $1,432,500 |
Showing the top 25 of 277 ranked suburbs. Scores are percentiles against every other suburb in Brisbane: 100 is the best in the city, 50 is mid-table. Click any suburb for its full profile.
Why do these 10 Brisbane suburbs lead for coffee? (October 2026)
Updated 15 October 2026 · one sentence of real reasons per suburb, from the data on this page. Crime here is published per police division, not per suburb, so these lines quote no crime figures.
- Brisbane City ★ 100
Brisbane City ranks #1: 100% of it within 400 m of a park, 157 public transport stops inside it for a transit score of 100, and 101 cafés.
- South Brisbane ★ 99
South Brisbane ranks #2: 92% of it within 400 m of a park, 55 public transport stops inside it for a transit score of 95, and 54 cafés.
- Stones Corner ★ 99
Stones Corner ranks #3: 21 public transport stops inside it for a transit score of 97, 90% of it within 400 m of a park, and 11 cafés.
- Albion ★ 98
#4 Albion — 86% of it within 400 m of a park, plus 12 cafés, and 29 public transport stops inside it for a transit score of 87.
- Milton ★ 98
Milton takes #5 on 40 public transport stops inside it for a transit score of 98, with 14 cafés, and 78% of it within 400 m of a park.
- West End ★ 98
What lifts West End to #6 is 70 public transport stops inside it for a transit score of 96; it also has 48 cafés, and 76% of it within 400 m of a park.
- Spring Hill ★ 98
What lifts Spring Hill to #7 is 100% of it within 400 m of a park; it also has 59 public transport stops inside it for a transit score of 99, and 18 cafés.
- Woolloongabba ★ 97
What lifts Woolloongabba to #8 is 59 public transport stops inside it for a transit score of 93; it also has 23 cafés, and 1 government primary school inside the suburb.
- Fortitude Valley ★ 97
Fortitude Valley ranks #9: 55 public transport stops inside it for a transit score of 99, 23 cafés, and 2 mapped schools nearby.
- Herston ★ 96
Herston (#10) scores on 100% of it within 400 m of a park and 25.2 ha of parkland per 1,000 residents, and 7 cafés.
Why each of the top 10 suburbs for coffee in Brisbane ranks where it does
Written from this page's own data: each figure below is the suburb's own value, set against the Brisbane median where we hold one.
1. Brisbane City
Brisbane City is #1 of 277 ranked Brisbane suburbs on this list, with a score of 100/100. It has 8.02 cafés per 1,000 residents (101 mapped), against a Brisbane median of 0.26. The trade-off: it scores 10/100 for value for rent, so it is weaker there. It covers 2.6 km² with about 12,587 residents (census).
2. South Brisbane
South Brisbane is #2 of 277 ranked Brisbane suburbs on this list, with a score of 99/100. It has 3.78 cafés per 1,000 residents (54 mapped), against a Brisbane median of 0.26. The trade-off: it scores 9/100 for value for rent, so it is weaker there. It covers 2.2 km² with about 14,292 residents (census).
3. Stones Corner
Stones Corner is #3 of 277 ranked Brisbane suburbs on this list, with a score of 99/100. It has 4.71 cafés per 1,000 residents (11 mapped), against a Brisbane median of 0.26. The trade-off: it scores 37/100 for value for rent, so it is weaker there. It covers 0.6 km² with about 2,336 residents (census).
4. Albion
Albion is #4 of 277 ranked Brisbane suburbs on this list, with a score of 98/100. It has 3.48 cafés per 1,000 residents (12 mapped), against a Brisbane median of 0.26. It covers 1.3 km² with about 3,446 residents (census).
5. Milton
Milton is #5 of 277 ranked Brisbane suburbs on this list, with a score of 98/100. It has 4.45 cafés per 1,000 residents (14 mapped), against a Brisbane median of 0.26. It covers 1.2 km² with about 3,144 residents (census).
6. West End
West End is #6 of 277 ranked Brisbane suburbs on this list, with a score of 98/100. It has 3.26 cafés per 1,000 residents (48 mapped), against a Brisbane median of 0.26. The trade-off: it scores 40/100 for value for rent, so it is weaker there. It covers 2.3 km² with about 14,730 residents (census).
7. Spring Hill
Spring Hill is #7 of 277 ranked Brisbane suburbs on this list, with a score of 98/100. It has 2.73 cafés per 1,000 residents (18 mapped), against a Brisbane median of 0.26. The trade-off: it scores 29/100 for parks, so it is weaker there. It covers 1.3 km² with about 6,593 residents (census).
8. Woolloongabba
Woolloongabba is #8 of 277 ranked Brisbane suburbs on this list, with a score of 97/100. It has 2.65 cafés per 1,000 residents (23 mapped), against a Brisbane median of 0.26. The trade-off: it scores 20/100 for value for rent, so it is weaker there. It covers 2.5 km² with about 8,687 residents (census).
9. Fortitude Valley
Fortitude Valley is #9 of 277 ranked Brisbane suburbs on this list, with a score of 97/100. It has 2.37 cafés per 1,000 residents (23 mapped), against a Brisbane median of 0.26. The trade-off: it scores 16/100 for value for rent, so it is weaker there. It covers 1.4 km² with about 9,708 residents (census).
10. Herston
Herston is #10 of 277 ranked Brisbane suburbs on this list, with a score of 96/100. It has 3.03 cafés per 1,000 residents (7 mapped), against a Brisbane median of 0.26. It covers 1.6 km² with about 2,311 residents (census).
How do these suburbs compare head to head?
What else do people ask about suburbs for coffee in Brisbane?
What are the best suburbs in Brisbane for coffee?
On our October 2026 data the top five are Brisbane City (100/100), South Brisbane (99/100), Stones Corner (99/100), Albion (98/100), Milton (98/100), out of 277 ranked Brisbane suburbs.
How is this ranking calculated?
Cafés per 1,000 residents from OpenStreetMap, as a percentile. Per-resident rather than per-suburb deliberately: raw counts just rank the biggest suburbs. 277 of 277 Brisbane suburbs had enough data to be ranked. Updated October 2026.
Is this ranking sponsored?
No. No ranking on this site is sold or sponsored. It is computed from open data: GPS activity traces, official crime statistics, the ABS census and OpenStreetMap.
What other Brisbane rankings are there?
Sources: open GPS activity traces, official crime statistics, ABS census,
OpenStreetMap (ODbL). Sale prices: Queensland Regional Profiles (QGSO), 12 months ending 31 March 2026 — © The State of Queensland (Queensland Treasury), Queensland Government Statistician's Office, Queensland Regional Profiles, CC BY 4.0; suburb-to-SA2 placement via ABS ASGS 2021 (CC BY 4.0). Queensland publishes sale medians per ABS Statistical Area Level 2 (SA2 — "broadly equivalent to suburb size"), not per suburb, so this is the median for the SA2 the suburb sits in (named next to each figure when it differs); detached dwellings = houses, attached = units. The window is the latest 12 months, not a quarter, and QGSO withholds medians under 10 sales. No ranking on this site is sold or sponsored.
← all 277 Brisbane suburbs, with sliders